 Skycruncher
experiment, September 2026
Are the spiral arms in my Seestar picture of the Triangulum Galaxy (M 33) real, or could some of what I see be random noise? I split one night's 1,115 good frames into two halves, every other frame, and stacked each half on its own. Both halves show the same two-armed pattern, pointing the same way, in 33 of the 34 rings I could test, from near the core out to 35 arcminutes (an arcminute is a sixtieth of a degree; the full Moon is about 31 across), so the pattern is not random noise. A professional sky survey agrees with my arms near the center and in a middle band, but not everywhere, and that part is still open.
From 1,301 ten-second Seestar S30 Pro frames of M 33 taken in one night on an alt-azimuth mount, 1,115 passed an automated selection and were split by time order into even (558) and odd (557) halves, stacked identically. The half-difference's blank-sky scatter is 2.345 ADU against 2.364 predicted for white noise (ratio 0.992). The m = 2 Fourier phase of the deprojected disk agrees between the halves within 2σ in 33 of the 34 rings where both halves reach S/N ≥ 3, from 1.5′ to 35.5′. That excludes noise, not systematics the halves share. Against Legacy Surveys DR10 g+r, the phase agrees within about 12° at 1.5–8.5′ and 15.5–21.5′, and differs by 25–68° at 9.5–14.5′ and 22.5–29.5′.
Two independent half-stacks agree on the direction of M 33's two-armed pattern in 33 of 34 rings from the core out to 35 arcminutes (measured).
The arm testPixel to pixel, the difference between the halves is as noisy as pure chance predicts, to within 1 % (measured).
The noise testOf the extra blotchiness in the background at a 4-arcminute scale, 93 % is the same in both halves, so more frames won't remove it (measured; its cause is inferred).
What the test can't seeA smart telescope like the Seestar takes many short exposures (frames, or subs) and adds them up, which is called stacking. Every frame has random grain in it, called noise: the light arrives as a trickle of individual photons, and the camera adds a little of its own. Stacking averages the grain down, but never to zero, so a faint, patchy feature in a stack can always be partly noise. A galaxy's outer spiral arms are exactly that kind of faint, patchy feature.
There is a simple test. Split the frames into two halves, stack each half separately, and compare. Random noise is different in every frame, so it can't line up in both halves. Anything that shows up in both, in the same place, is not random noise (stated: this is the logic of the test). To make the halves as alike as possible, I alternated: counting the frames in time order from zero, the even-numbered ones (0, 2, 4 and so on) went into one half and the odd-numbered ones (1, 3, 5) into the other. That way both halves saw the same sky, the same haze and the same rotation of the field through the night.
I asked two things. Is the noise left in my stack the noise that pure chance predicts? And are M 33's spiral arms in the same place in both halves, at every distance from the center?
Split-half (jackknife) tests are a standard way to separate signal from noise: two disjoint subsets of exposures share the signal and everything else that is common to both, while their independent noise cancels only in the sum. The difference image (A−B)/2 then carries the full stack's random noise with the signal removed, so it measures the true noise of the stack, correlations included, without a model of the sky or the galaxy.
I interleaved the halves in time (after selection, frames sorted by DATE-OBS; A = even index, B = odd index), so slow changes in sky brightness, transparency, seeing and field rotation affect both halves equally. That is the right design for a noise test, and the wrong one for catching systematics: anything that varies slowly through the night lands in both halves. Two questions, both with pass marks written down before the metrics pass: does the (A−B)/2 scatter match the white-noise prediction from the per-frame noise, and does the m = 2 Fourier phase of the deprojected disk agree between halves ring by ring?
The night of 18–19 September 2026, my Seestar S30 Pro (a 30 mm smart telescope) took 1,301 frames of M 33, each 10 seconds long, over about 6 hours from a dark site (measured, from the files). The Seestar sits on an alt-azimuth mount (it follows a target by moving up-down and left-right, not around an axis aligned with the Earth's), so the field of view slowly rotates through the night: by 140° on this night (measured). Before stacking, I measured every frame: how bright and how grainy the sky was, how sharp and round the stars were, and how much light got through the air. A program then dropped frames that were clearly worse than their neighbors in time, without me picking them by hand.
It dropped 186 frames (measured). Most were from the last 40 minutes, when dawn twilight brightened the sky (the red dots at the right of the chart, which run off its top). Five came from the first two hours, when the stars came through dimmer than usual, probably from thin haze (the cause is inferred); two had soft stars; and about forty were scattered odd ones, frames that looked unlike their neighbors in time. The other 1,115 frames, 3.1 hours of exposure, were split every other frame into the two halves (blue and violet).
What it means for your imaging: on a clear night, almost every frame helps. By the score I set before looking, each of the 1,115 surviving frames still raised the stack's signal-to-noise (how far the galaxy's light stands above the grain), so none was dropped for being merely average (measured on this night). The frames worth throwing out were the obvious ones: twilight, haze and a few odd ones out (how well this carries over to your nights is inferred).
Data: 1,301 raw 10 s frames (GAIN 200, IR-cut filter, BAYERPAT GRBG, alt-azimuth mode), 07:03 to 13:10 UTC on 19 September 2026, total field rotation 140°, with a 10-minute gap at the meridian crossing where the telescope re-framed near the zenith (measured). No darks, flats or bias frames were taken. Luminance is a 2×2 superpixel sum (G+R+B+G) of the raw Bayer matrix, 1080 × 1920 at 7.48″/px; no demosaicing interpolation enters the stack. All ADU on this page are in these superpixel-sum units, where one frame's blank-sky noise is about 82 ADU per pixel (measured).
Selection had two screens and an objective. The objective and its thresholds were configured before the metrics pass; the first screen was added in a mid-run redesign (see what went wrong), with the same 5 robust σ threshold. It compares each frame with its own ±90 s neighbors on 60″/px linear thumbnails (derotated by the parallactic-angle difference) and rejects any frame beyond 5 robust σ in the bad direction on any of: sky level, high-pass noise, flux scale against the neighbors (a transparency proxy), sharpness, or the scatter, large-scale part or gradient of its residual against the neighbors' median: 179 rejected. The second screen, on per-star metrics after registration, rejected 5 on transparency and 3 on FWHM (one frame on both). The objective ranks frames by qi = giTi/σi, with gi = s²/(s² + FWHMi²) the peak dilution of a 60″ feature, and maximizes SNR(N) = Σgi / √Σ(σi/Ti)². The curve rose through the whole pool, so N* = 1,115 and the objective itself dropped nothing. With a 60″ target feature the PSF barely enters gi; that was a declared judgment call.
Frames were registered by star matching to one plate-solved reference frame (1,121 of 1,122 matched, median 195 stars, rms 0.16 px; one fell back to astrometry.net) and checked against an independent astrometry.net solution of every frame: median offset 0.80″, worst 7.2″ in a corner (measured). Every frame was resampled onto the reference grid with a Lanczos-3 kernel and combined as an equal-weight mean after flux normalization by 1/Ti, with a per-pixel 3σ clip about the median. A, B and the full stack use the identical combine.
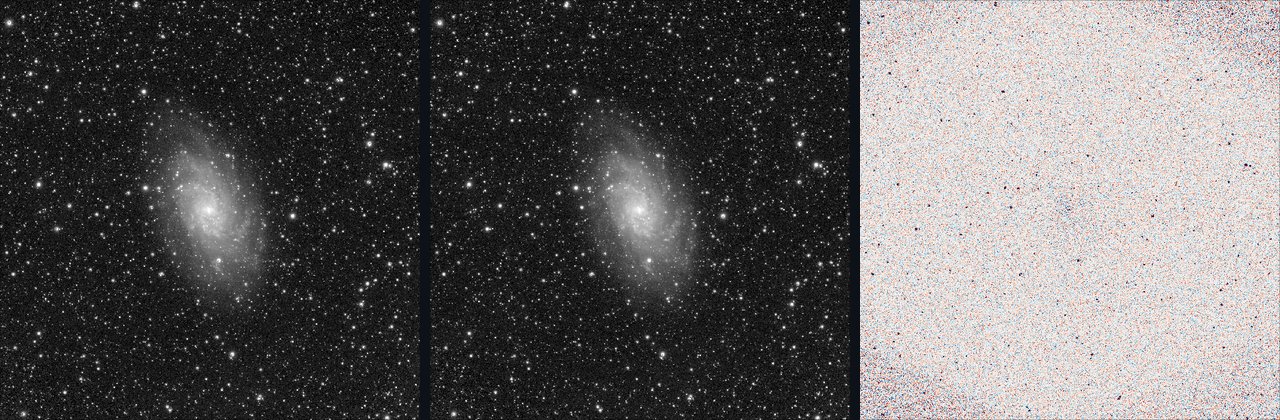
To the eye the two halves look the same, and their difference is a field of fine grain with no galaxy left in it (illustrative: that's what the pictures show). The rest of the page puts numbers on both impressions.
The difference panel shows (A−B) in units of its blank-sky robust σ (4.69 ADU, i.e. 2 × 2.345). Residuals at bright stars come from the per-pixel clip and the PSF changing between frames, and the corners are noisier because the 140° field rotation leaves them covered by fewer frames (both inferred). Blank sky for every statistic below is the covered area (both halves at ≥ 90 % of their frame count, 16 px edge trim) outside 1.3 × the galaxy's catalog ellipse, minus a source mask (2σ on the 1-px-smoothed full stack, dilated by 4 px): 29 % of the covered grid (measured).
Pure random noise has a fingerprint: if you average it over a bigger patch of sky, it shrinks in a predictable way. Average a 2 × 2 patch (4 pixels) and the grain halves; a 4 × 4 patch (16 pixels), and it drops to a quarter. Anything that doesn't shrink that fast isn't pure noise: it's structure, such as faint background glow, gradients or dust.
The chart measures exactly that. It averages the blank sky (the parts of the picture with no stars or galaxy in them) in squares from 1 pixel up to 64 pixels across (8 arcminutes, about a quarter of the full Moon) and shows how much more scatter is left than pure noise would leave. A value of 1 means pure noise.
Before stacking, every frame has to be shifted and rotated onto a common grid of pixels, which means estimating values between the original pixels (resampling). The second switch on the chart picks between two common ways of doing that, Lanczos-3 (the one used for every stack on this page) and the simpler bilinear. Bilinear makes each pixel look less grainy, but only by smearing the grain across neighboring pixels, which shows up as a higher curve at small squares (measured).
What it means for your imaging: past a certain point, more frames don't make a smoother background. At the 4-arcminute scale my stack's background scatter is 3.6 times what its noise alone would give (measured). The extra part is 0.277 ADU in the whole stack but only 0.073 ADU in the even-minus-odd difference, so 93 % of it (counted as variance, the square of the scatter) is the same in both halves (measured; allowing for the limited number of 4-arcminute squares, at least about 85 %). I also tried fitting and removing a curved background from every single frame before stacking. It made no difference (the floor went from 0.2770 to 0.2776 ADU, measured). The likely cause is something every frame shares, such as uneven illumination across the sensor that flat frames would correct, or real faint light on the sky (inferred: this test can't tell which).
A fair note on the Seestar app's stack: my stack's background at that scale came out 5 % smoother (0.288 against 0.302 ADU, measured), but that is within the scatter I'd expect from the number of sky squares measured, so read it as "about the same" (inferred). Pixel to pixel, the app's stack is actually the less grainy one (2.08 against 2.54 ADU, measured), partly because it used more frames and partly because its processing smears the grain over neighboring pixels, as bilinear does (inferred). None of this is a contest of stacking methods: the app stacked all 1,301 frames, including the twilight ones I dropped, and I didn't run the app on my selection.
For each image I compute the robust σ of the mean of blank pixels in square blocks of b = 1–64 px (a block counts if at least half its pixels are blank) and compare it with the white-noise expectation σ1/b. The excess is σb/(σ1/b), and the non-white floor in quadrature is √(σb² − (σ1/b)²). The full stack has an order-2 polynomial sky (fitted outside the galaxy) subtracted first; the difference needs none.
White-noise prediction (pass mark: within 20 %). Propagating each frame's blank-sky σi and transparency Ti through the equal-weight mean, with the resampling kernel's white-noise variance factor fK:
σpred = ½ √( fK [ ΣA(σi/Ti)²/NA² + ΣB(σi/Ti)²/NB² ] )
With fK = 0.799 for Lanczos-3 (analytic; 0.797 measured on a synthetic rotated white-noise field), σpred = 2.364 ADU against a measured robust σ of (A−B)/2 of 2.345: ratio 0.992, met (measured). Neighbor correlations in the difference are +0.14 at lag 1 along both axes, −0.08 on the diagonals and −0.02 at lag 2. The excess over white is 1.14 / 1.20 / 1.27 / 1.27 / 1.42 / 1.26 at 2 / 4 / 8 / 16 / 32 / 64 px; the full stack's is 1.20 / 1.39 / 1.77 / 2.36 / 3.63 / 3.41.
The kernel sets the small-scale correlation. A bilinear resample of the same frames gives a lower per-pixel σ (1.750 ADU against a 1.766 prediction, fK = 0.446) but more correlation: lag-1 +0.24 and an excess of 1.27 at 2 px and 1.79 at 32 px in the difference (measured). The kernel toggle on the chart shows both. A per-pixel σ alone flatters the bilinear stack.
The large-scale floor. At 32 px (239″, about 4′) the full stack's floor in quadrature is 0.277 ADU and the difference's is 0.073, so (0.277² − 0.073²)/0.277² = 93 % of the full stack's non-white variance at that scale is common to both halves (measured). That floor is 0.11 of the stack's per-pixel σ. Replacing the constant per-frame sky by an order-2 polynomial per frame moved the 32 px floor from 0.2770 to 0.2776 ADU (−0.2 %; pass mark ≥ 10 %, not met). That is expected in hindsight: the per-frame gradients are small (median 2.7 ADU per frame height against an 82 ADU per-pixel σ), the 140° rotation averages them, and the difference's own 0.073 ADU floor caps what any per-frame sky model could remove at ≤ 3.5 % in quadrature. The common part is structure fixed in both halves: real faint light (unmasked faint sources, Galactic cirrus), or a calibration error that every frame shares, such as uncorrected vignetting and dust shadows averaged over the same rotation angles in both halves (inferred; the split cannot separate these).
The Seestar app's stack (all 1,301 frames, twilight included) was brought onto my grid, scaled by the median flux ratio of 1,217 matched stars (2.81, star-to-star scatter 0.26), reduced to the same 2×2 sum, and passed through the same mask and block statistic. At 32 px its σ is 0.302 ADU against my stack's 0.288 (pass mark: mine lower; met by 5 %), and its excess at 2 px is 1.46 against my 1.20 (measured). The 5 % margin is not significant on its own: each 32 px σ comes from 129 blocks, a sampling uncertainty of about 10 % for a robust σ (inferred from the block count; the two stacks share the same sky and blocks, so the ratio is better determined than that, but I did not compute it). At 1 px the app's stack is the less noisy, 2.08 against 2.54 ADU (measured), from 17 % more frames and stronger small-scale correlation (inferred). The selection differs (1,301 against 1,115 frames), so this compares two products, not two algorithms.
Sampling uncertainty of the block statistic. The block counts fall from 258,877 at 1 px to 129 at 32 px and 12 at 64 px (measured), so a robust σ is uncertain by about 10 % at 32 px and about 35 % at 64 px (inferred, √(1.36/n) for a MAD-based σ from n blocks; neighboring blocks are not fully independent). Over that range the difference's 32 px floor spans about 0.058–0.087 ADU and the share of the stack's non-white variance common to both halves stays above about 85 %. The 64 px points, and the dip from 32 to 64 px in both curves, are within that noise.
Disclosed change after looking. The block statistic follows an earlier method of mine on a galaxy stack (M 66), which required 80 % blank pixels per block. In this deep, star-dense field no 32 px block reached 80 %, so I lowered the threshold to 50 % after seeing that, before computing any of the numbers above. A lower threshold lets more of each block's mean come from fewer pixels near masked sources, which can raise the measured floor slightly; it applies equally to all three curves.
M 33 is a spiral galaxy tilted about 55° from face-on (a published catalog value, which I used as given), so it looks like an oval. To measure its arms, I first stretched the image to undo the tilt, as if seen face-on (the picture below). Then I cut the face-on disk into 35 rings, each one arcminute wide, from 1 to 36 arcminutes from the center. In each ring I measured how much brighter it is in two opposite directions than in between: a two-armed spiral makes each ring brighter on two opposite sides. The angle where that pattern peaks is its direction (astronomers call it the phase). In a spiral, that direction turns steadily as you go outward, tracing the arms.
The test is whether the even half and the odd half agree on that direction, ring by ring, within their measured uncertainty. Before looking, I wrote down that at least 90 % of the rings should agree, counting only rings where the pattern is at least 3 times bigger than its noise in both halves (that ratio is called the signal-to-noise, S/N).
They agree in 33 of 34 such rings, from 1.5 to 35.5 arcminutes (measured). Inside 20 arcminutes the two halves point the same way to within 2°, and the pattern is 22 to 240 times its noise (measured). The one ring that misses, at 28.5 arcminutes, misses by 6° against a 5° allowance; with 34 rings and an allowance of twice the standard uncertainty (written 2σ, two sigma), one or two misses are expected by chance (inferred). One ring, at 33.5 arcminutes, was too faint in one half to count.
Rings. Each pixel is deprojected with the catalog geometry (center 01:33:50.9 +30:39:36, PA 22.5°, i = 55°; start values, not fitted) to a face-on radius R and azimuth φ measured from the major axis. Rings are 1′ wide from 1′ to 36′, with 36 azimuth bins each. Pixels above the bin median + 3 robust σ in the full stack (stars, H II knots) are masked, and the same mask is used for A, B and the full stack, which share the full stack's order-2 sky model. From the bin means I take the Fourier terms cm = 2⟨I cos mφ⟩, sm = 2⟨I sin mφ⟩, the amplitude Am = √(cm² + sm²) and the phase φm = atan2(sm, cm)/m. For m = 2 the phase is defined modulo 180°; ±90° is the minor axis.
Errors. A block wild bootstrap of the difference image: 200 draws in which 32 px blocks of (A−B)/√2 are multiplied by random signs, each draw a noise realization of one half with the measured correlations kept. The amplitude σ and the phase σ come from the spread of the Fourier terms over the draws.
Test (written down in advance). Over rings with S/N ≥ 3 in both halves, |φA − φB| ≤ 2√(σA² + σB²) in at least 90 % of rings. Result: 33 of 34 (97 %), met (measured). The miss is at 28.5′ (5.9° against a 5.0° tolerance); 33.5′ fails S/N in B (2.7). With 34 rings and a 2σ tolerance the expected number of chance misses is about 1.6, so one miss is unremarkable (inferred). Inside 20′ the phase differences are 0.0–2.0° at S/N 22–240. The same test on the other harmonics: m = 1 agrees in 34 of 35 rings, m = 3 in 34 of 34 (measured).
The test is strong against noise and weak against anything else. The two halves are interleaved, use the same sky model, mask, geometry and grid, and both include every slow change through the night, so agreement says the m = 2 signal is not noise at the radii tested, 1.5′ to 35.5′. It does not say the signal is light from the galaxy's arms.
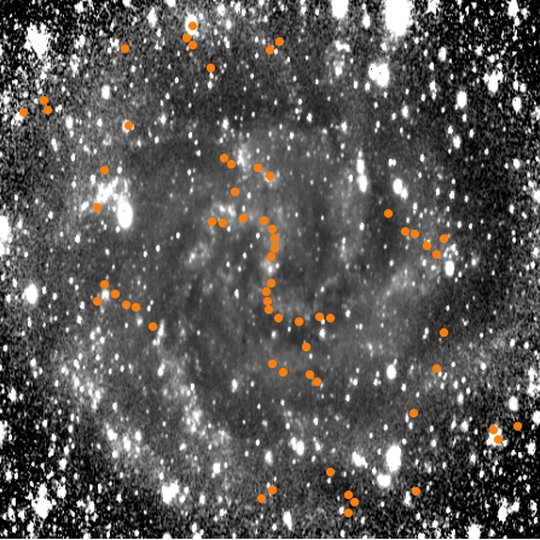
Since the split can't catch errors that both halves share, I ran the same ring measurement on M 33 from the DESI Legacy Imaging Surveys (DR10), a professional sky survey taken with large telescopes and different cameras, filters and processing. Where my arms and the survey's point the same way, the pattern is very likely real light from the galaxy.
They agree within about 12° from the core to 8.5 arcminutes and again from 15.5 to 21.5 arcminutes (measured; orange line on the chart). They disagree by 27 to 47° between 9.5 and 14.5 arcminutes, the distance of M 33's giant star-forming regions such as NGC 604, possibly because the survey's sharper images and different color filters weigh those bright knots differently (inferred, not tested). They also disagree by 25 to 68° between 22.5 and 29.5 arcminutes, where my pattern swings toward the galaxy's short axis. That is more typical of a slightly wrong tilt angle or a background problem than of arms (inferred). I don't know yet which, or whether the survey's own background removal around such a large galaxy plays a part.
What it means for your imaging: an odd-even split is a free check you can run on your own stacks. Stack the odd and even frames separately and compare them; a faint feature that appears in only one is noise. But a feature that appears in both isn't proven real: gradients, dust shadows and other errors that every frame shares will appear in both halves too.
Comparison image: Legacy Surveys DR10 g+r (g and r planes of a grz cutout at 7.477″/px, so close to my pixel scale), measured with the identical ring code, geometry and 3σ knot clip on its own image. The median |Δφ2| between my full stack and Legacy over the 33 rings that passed the split test is 12.1° (measured). By radius:
These ranges were read off after the comparison was run; no agreement threshold for Legacy was set in advance. Legacy's own sky subtraction around a galaxy about 70′ across is a further candidate for the outer disagreement.
The odd-even split answers one question well: is a feature bigger than the random noise? It is blind to anything that is the same in every frame, because that lands in both halves and agrees with itself perfectly (stated: a property of the test). For my data that includes:
Beyond about 20 arcminutes from the center, where M 33 is faintest and the survey disagrees, I wouldn't trust the arm directions until I have taken flat frames or run a different split: one by the camera's rotation angle instead of odd and even, which would expose any pattern fixed to the sensor (inferred).
Systematics that the interleaved split cannot detect: (1) sensor-fixed illumination errors, since no flats exist and both halves sample the same rotation angles, so a sensor-fixed pattern averages to the same sky-frame pattern in each; (2) the shared order-2 sky model and its level at R > 20′; (3) the geometry (i, PA are catalog start values, not fitted); (4) the shared source and knot mask. A sharper test for (1) splits by field rotation angle (or by time blocks rather than alternate frames), so a sensor-fixed pattern lands at different sky angles in each half. Until that or flats are in hand, m = 2 phases beyond about 20′ are not trusted.
A post-hoc vignetting check (not planned in advance) estimated the illumination from the per-frame sky meshes. It came out flat to +3.5 % with the corners brighter, which isn't plausible vignetting: the sky is only about 190 ADU above a 4,448 ADU electronic offset, so the estimate is degenerate with the offset. It changes no phase and is inconclusive (measured; interpretation inferred).
Before I measured the frames, I wrote down five pass marks and a list of expectations. Four pass marks were met (one of them, my stack against the app's, only by a margin within the measuring scatter) and one failed: fitting a background to each frame did not reduce the blotchiness. The table has all of them, including the expectations I got wrong.
Fixed before the metrics pass: the five pass marks, the selection configuration (60″ target feature, 5 robust σ anomaly threshold, trail and saturation rules), the stacking choices (superpixel luminance, Lanczos-3, equal-weight clipped mean) and the half assignment rule. Decided after looking: the 50 % blank-block threshold, the selection redesign described under what went wrong, the vignetting check, and the reading of the Legacy comparison by radius.
| Written down in advance | What happened | |
|---|---|---|
| At least 95 % of frames plate-solve (their sky position found from the star pattern) | 1,301 of 1,301 | met |
| Even-minus-odd pixel noise within 20 % of the pure-noise prediction | 0.992 of the prediction | met |
| Two-armed direction agrees within 2σ in at least 90 % of rings with S/N ≥ 3 in both halves | 33 of 34 rings (97 %) | met |
| My stack's background at 32 px smoother than the Seestar app's stack | 0.288 against 0.302 ADU, a margin within sampling scatter | met, by 5 % |
| A curved background fitted to each frame lowers the 32 px floor by at least 10 % | 0.2770 to 0.2776 ADU (−0.2 %) | not met |
| Expectations | ||
| Star size and elongation peak around the meridian crossing | median 9.5″, about 14″ near the crossing | as expected |
| Selection keeps 60 to 90 % of frames, dropping twilight, cloud and elongated frames | 86 % kept; twilight and haze dropped, elongated frames kept (254 with clearly stretched stars, ellipticity above 0.3) | partly |
| Even-minus-odd: 1.05 to 1.2 times pure noise at 2 px, neighbor correlation under 0.15 | 1.14 times; 0.14 | as expected |
| Even-minus-odd: 1.5 to 4 times pure noise at 32 px | 1.42 times | slightly below |
| Whole stack above the difference at 16 px and beyond | 2.36 against 1.27 times at 16 px | as expected |
| Two-armed pattern significant from about 3′ to 15–20′ | 1.5′ to 35.5′ | wider than expected |
| A per-frame background fit gains 10 to 30 % | −0.2 % | wrong |
| M 33 is inside the Legacy Surveys DR10 footprint (I gave it 60 %) | it is | right |
The first selection plate-solved every frame on its own and compared each against one median image of the whole night. Partway through I replaced it with a cheaper, steadier design: screen each frame against its neighbors in time first, then line every frame up to one solved reference frame by matching stars, with per-frame solving kept only as a fallback and an independent check. The first selection kept 1,135 frames (measured); it was discarded, and every number on this page comes from the second. Because the change came after the run had started, the first screen is not counted among the things fixed in advance.
To compare frames quickly, I shrank each one to a small thumbnail (60″ per pixel). Rotating every thumbnail by the textbook field-rotation angle for an alt-azimuth mount was off by a typical 5° (up to 28° near the zenith) against the plate solutions (measured), which points to a mount that isn't perfectly level (inferred). A brute-force rotation search was worse: the thumbnails held too little star signal, and M 33 looks much the same turned half a turn, so the search couldn't tell 0° from 180° (measured). Comparing each frame only with its neighbors a minute and a half either side, which have barely rotated, worked.
The step that lines frames up by matching their stars (registration) first mapped the reference frame onto itself 10.4″ off, one pixel diagonally: an off-by-one in a coordinate convention (measured). Comparing against the per-frame plate solutions caught it. A second bug left 116 frames unmatched at large rotation angles, because the matching used stars from the whole frame instead of only the central disk that every rotation shares (measured). Both were fixed before any number on this page was made.
My noise statistic counts a block of sky only if most of it is free of stars. The rule I had used before (80 % star-free) left no 4-arcminute block at all in this deep, crowded field, so I lowered it to 50 %. That change was made after seeing the field, and it applies to every curve on the noise chart alike.
Exploratory
This is one night, one telescope and one galaxy, and nothing on this page has been repeated on fresh data. What I'm confident of: the noise in my stack is understood, and M 33's two-armed pattern stands above the noise in 34 of the 35 rings from 1.5 to 35.5 arcminutes, and points the same way in both halves in 33 of 34 (measured). What I'm not: whether the pattern beyond about 20 arcminutes is the galaxy's arms or something my missing flat frames left behind, and why the survey disagrees between 9.5 and 14.5 arcminutes. The next steps are a night with flat frames, and a split by rotation angle instead of odd and even.
Related: how precisely the same telescope places a star, measured on M 33 and M 31.
Exploratory. One night, one unit, one target; no confirmation on data the method was not built on. Established within that scope: the white-noise model of the stack (0.992), that the m = 2 signal exceeds the noise from 1.5′ to 35.5′ (S/N ≥ 3 in both halves in 34 of 35 rings, phases consistent in 33 of 34), and that structure common to both halves dominates the stack's large-scale floor (93 %, above about 85 % allowing for block sampling). Corroborated by an independent survey only at 1.5–8.5′ and 15.5–21.5′. Open: the cause of the 9.5–14.5′ and 22.5–29.5′ disagreements, and the m = 2 phases beyond about 20′, which need flats or a rotation-angle split. A confirmation would rerun the unchanged pipeline on a new night or another telescope, with the pass marks written down first.
Related: star-position precision on M 33 and M 31 with the same telescope.
 SkyCruncher