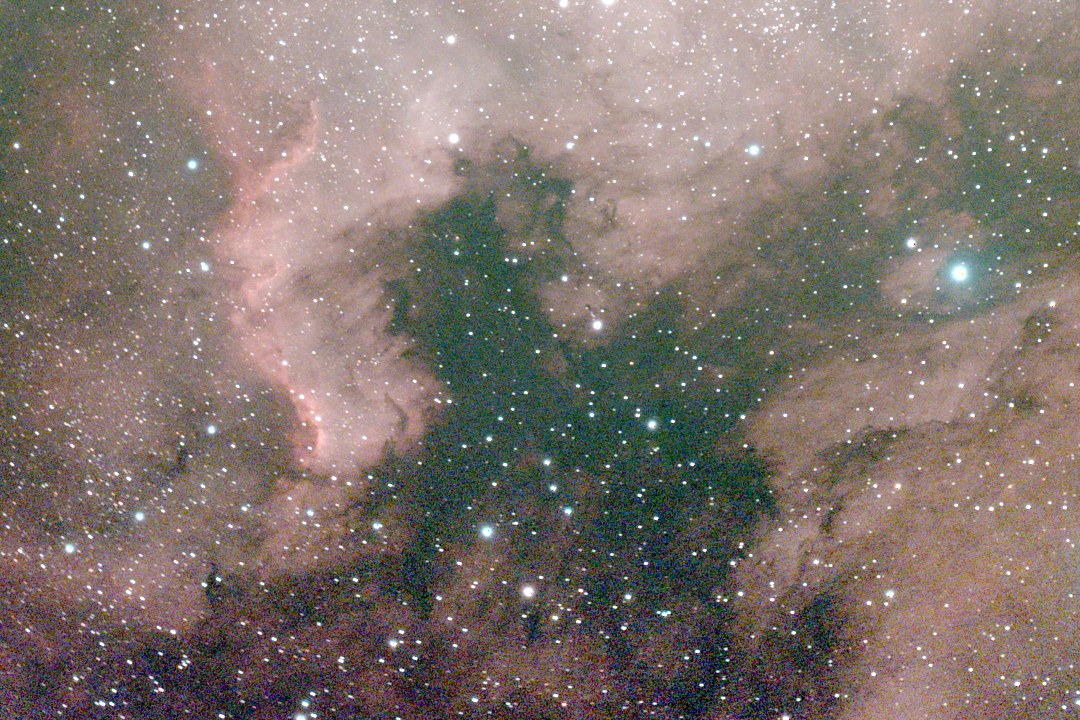
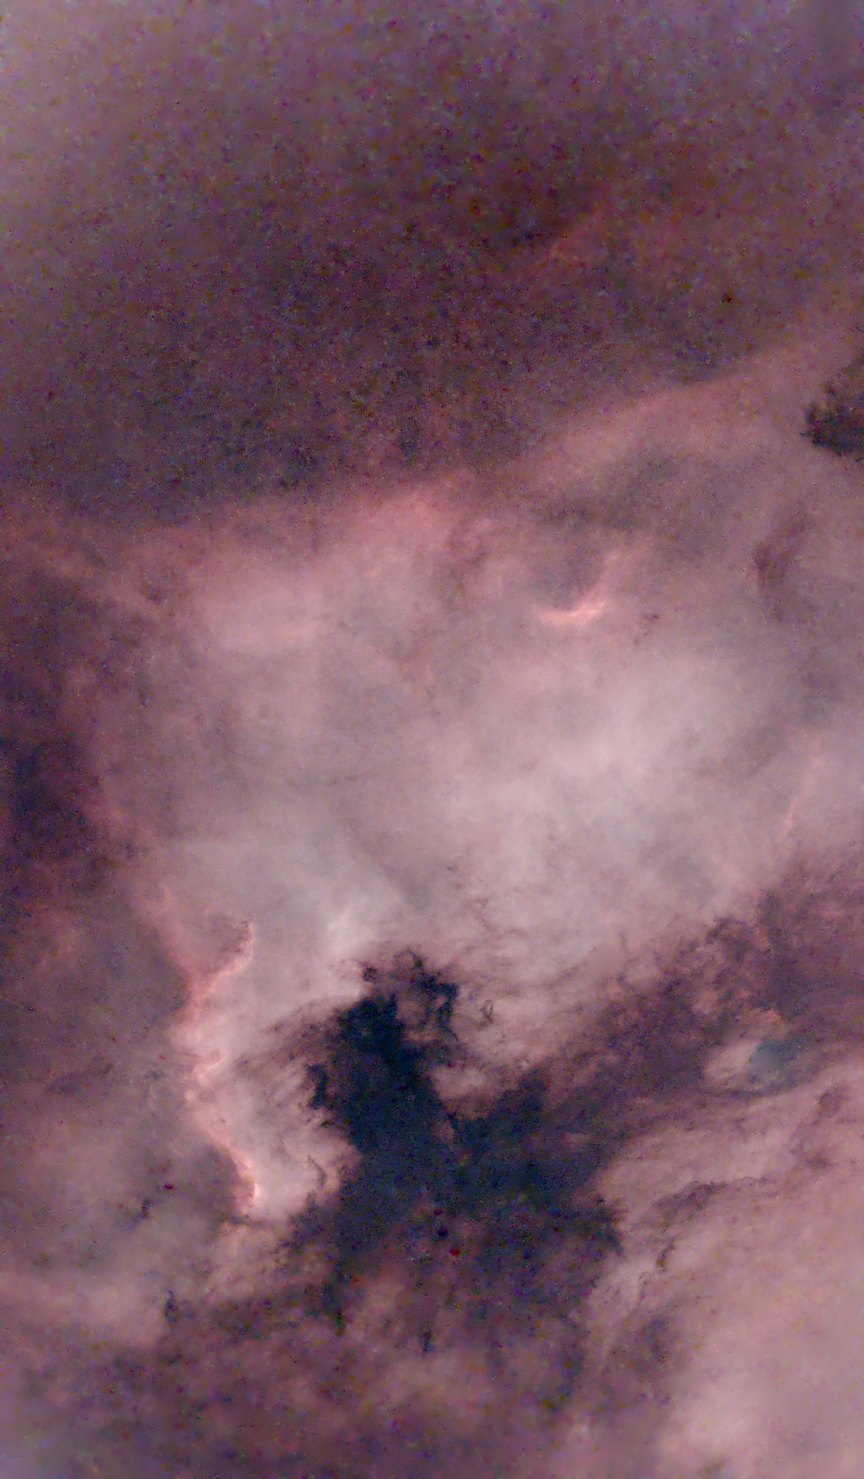
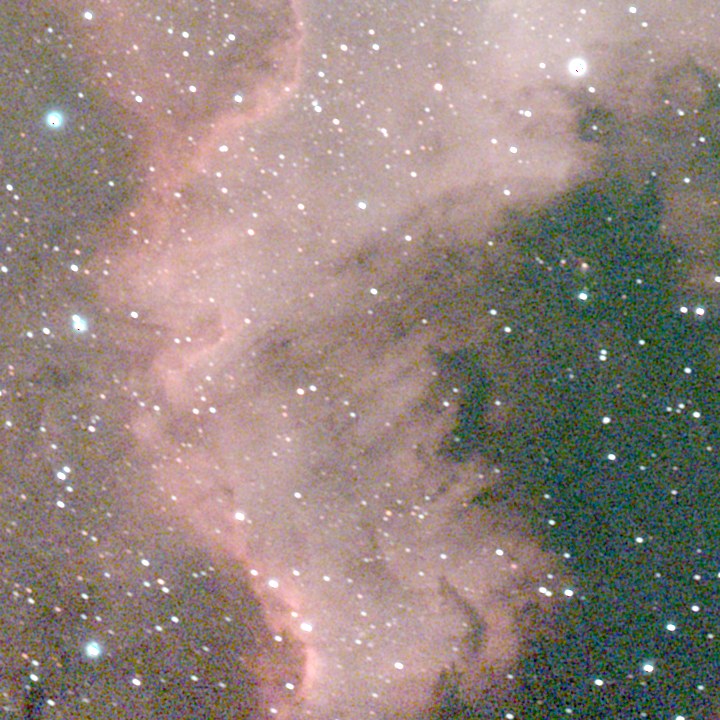
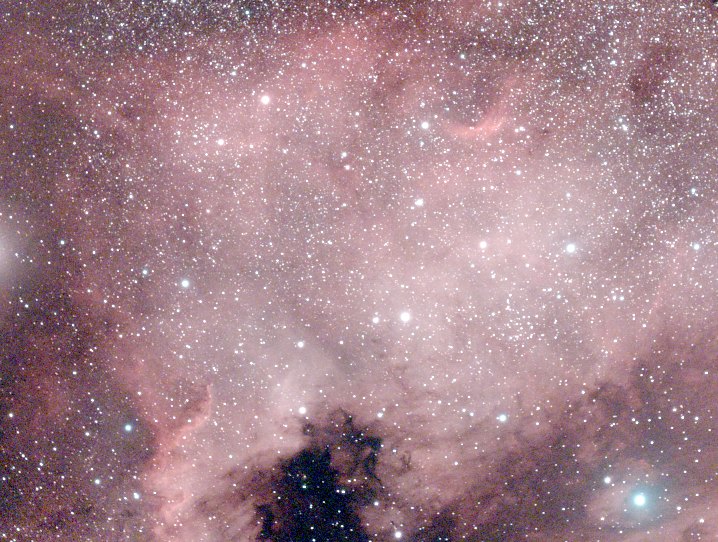
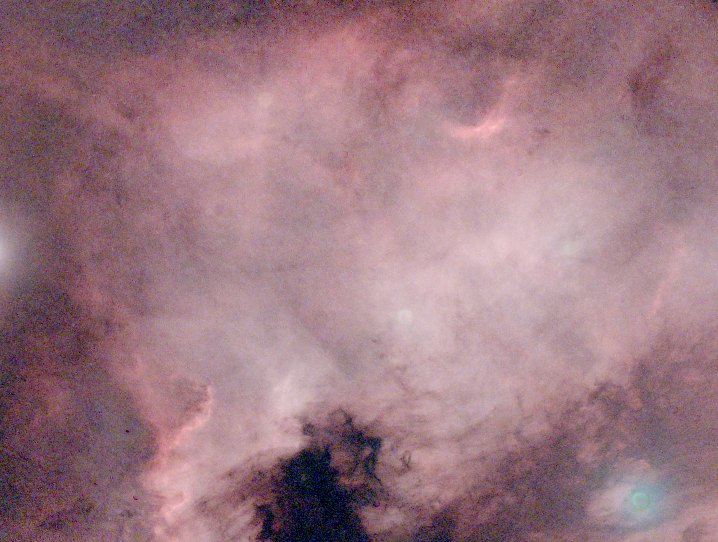
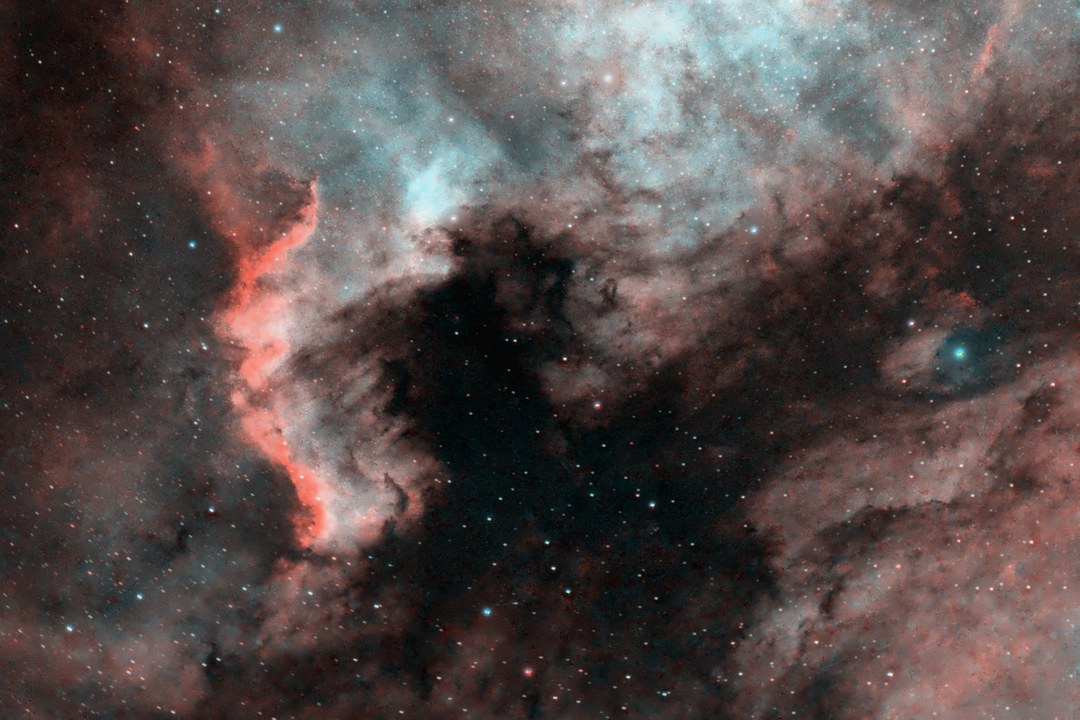
I subtracted 98,258 catalog stars from a Seestar image of the North America Nebula. The nebula stayed.
Star removal usually means a neural network deciding which pixels look like stars. I tried the opposite: put every Gaia star at its known position, draw it with the star shape measured from the same night, fit only how bright it is, and subtract it. The sky glow and the brightest stars' halos get their own models. What is left should be the gas, and that can be checked: against a 2.5 m survey telescope's Hα image, and against a second night.
Exploratory Both nights were used while developing the method. It has not yet been run unchanged on a night it has never seen.
98,258Gaia stars (G < 17) fitted and subtracted in this frame
532 × 10 sthe clear subs kept of 752 from 19 Sep 2026, Seestar S30 Pro
0.983rank correlation of the nebula's red channel with the IPHAS Hα survey, whole frame
0.996the same where 500+ subs overlap, survey defects left out
Before and after
Drag the divider
↔As capturedStarless + denoised
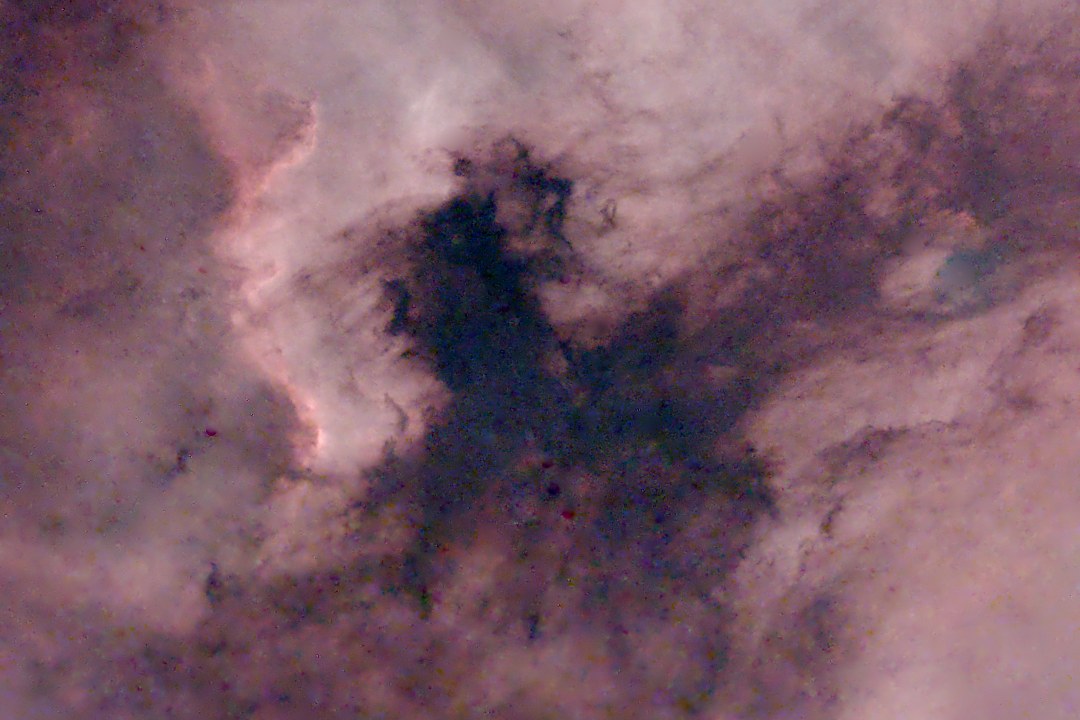
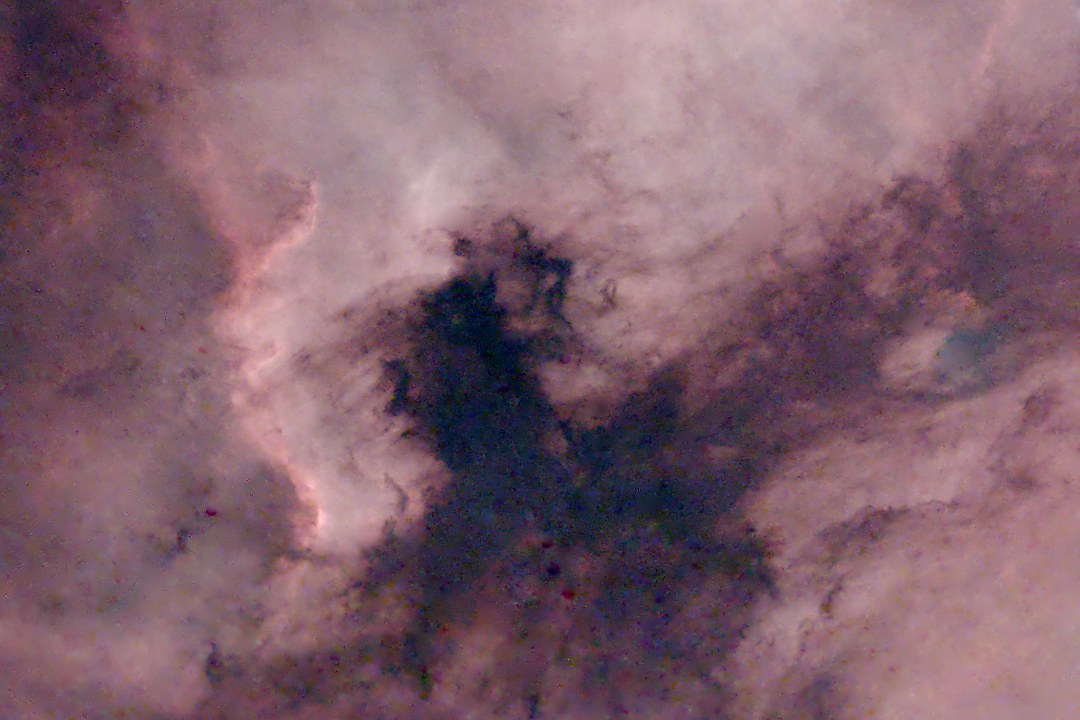
The “Gulf of Mexico” and the Cygnus Wall. Same pixels and the same stretch on both sides of the divider. The right side has the catalog stars, the bright-star halos and the sky glow subtracted, then noise reduction. The green cast on the left is sky glow. Nothing is painted in except the cores of the brightest stars, which are filled (see star halos); the bright star at the right edge is 57 Cygni.
The stack is four layers added together
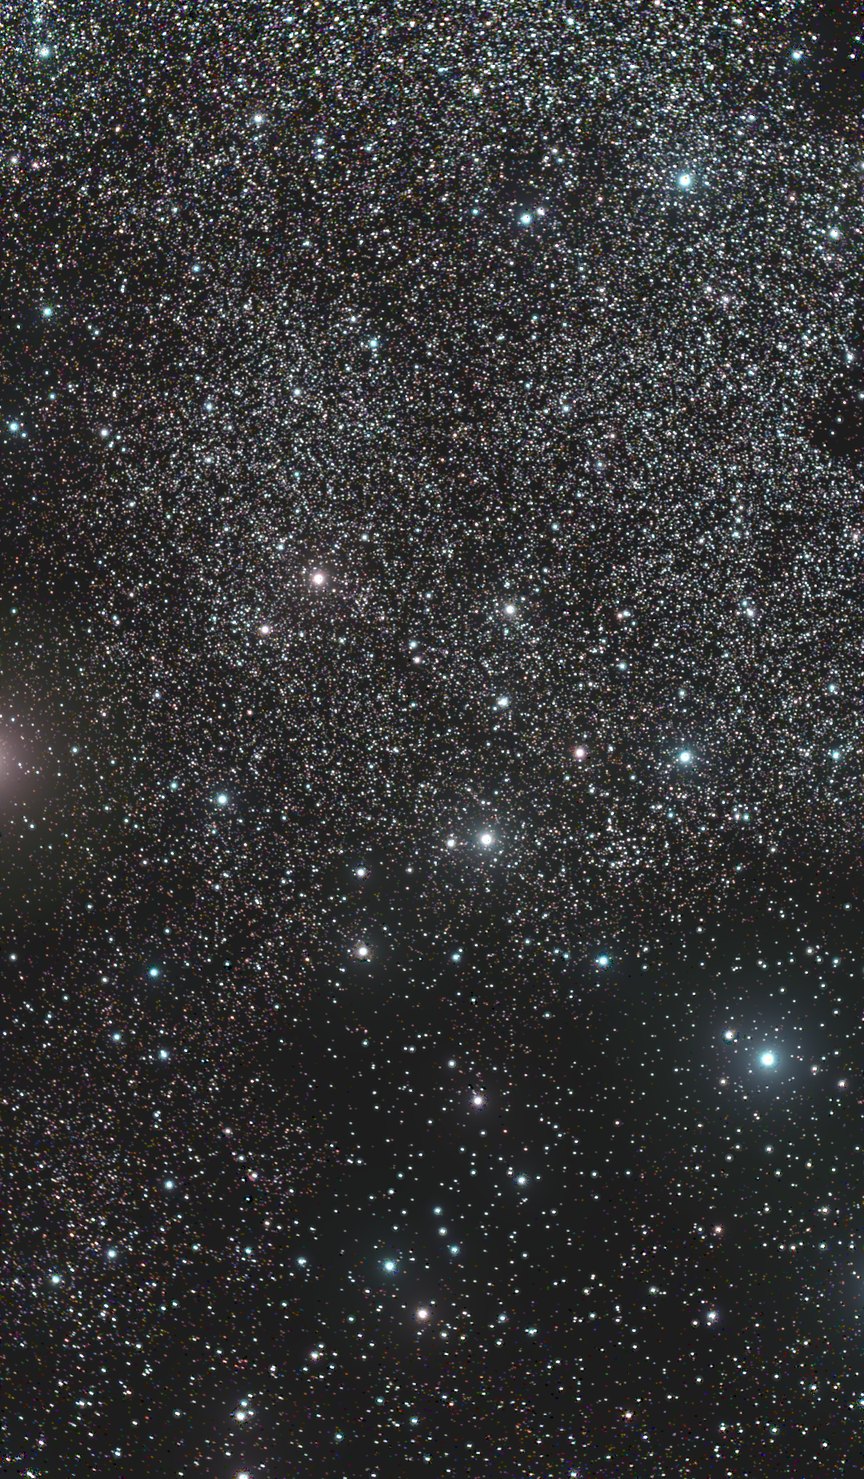
Instead of erasing stars, the method models each part of the picture on its own and subtracts the parts that aren't nebula. Choose a layer to see it by itself, on the full frame.
=+++
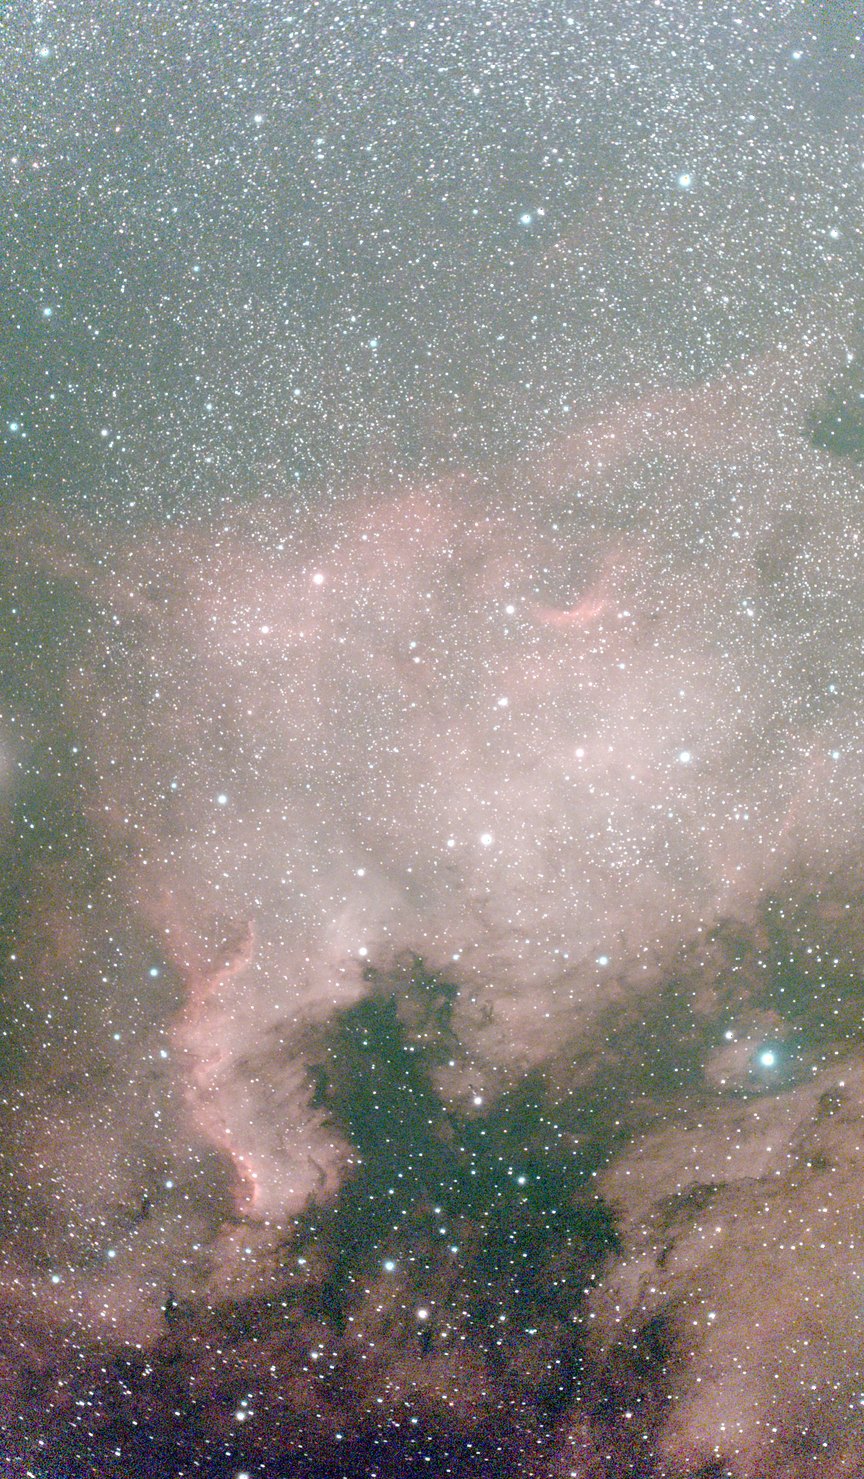
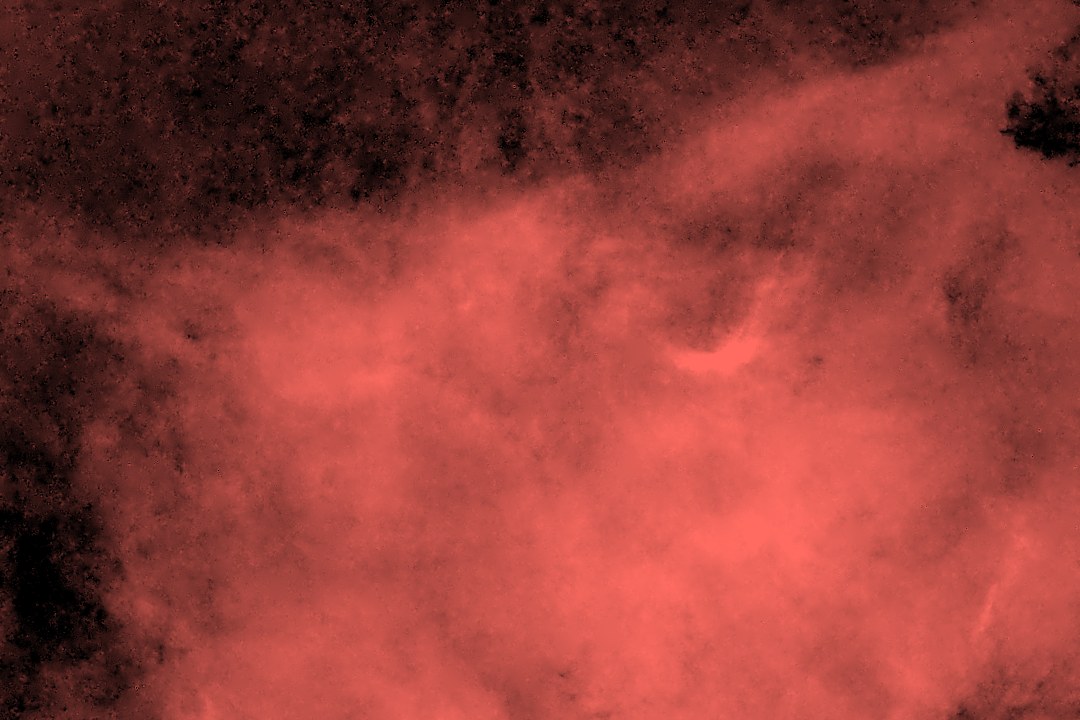
What the camera recorded: everything at once. Full frame, north up and tilted 33°, 3.66″ per pixel (shown binned 2 × 2). The layers add up to the stack except where bright-star cores are filled.
Clouds came in, so the stack was rebuilt
The first version of this page used every sub, added up as they came. But the night was clear and steady for only the first 1.8 hours. Then cloud moved in and the stars dimmed by up to 0.91 mag, and the cloud wasn't gray: green lost about 20 % more than red and blue. Because the field turns on an alt-az mount, different parts of the frame were built from different mixes of clear and cloudy subs, so the nebula's brightness and color carried that mix.
So I measured each sub's transparency, color by color, from about 80 Gaia stars per sub with known spectra, scaled every sub to the clearest stretch of the night, and kept only the subs that lost less than 0.5 mag to cloud and had sharp stars. The rules were written down before the transparency was measured.
532 of 752subs kept (1 h 29 min of 2 h 5 min)
0.91 magworst cloud loss, after 1.8 clear hours
24/17/22 → 17/10.5/15 %star brightness scatter vs Gaia spectra, R/G/B
Star brightness scatter: each star's measured flux against what its Gaia XP spectrum predicts through this filter, before and after the correction. The new stack's numbers are in its own units, set by the clearest part of the night, so on the nebula they run about 1.26 times the first stack's. For display, every image on this page is scaled back to the first version's brightness, so the pictures are comparable; no number on the page is scaled.
The brightest stars' halos, modeled instead of left behind
↔
57 Cygni (G 4.7, the Pelican's head), full resolution, starless and noise-reduced, one stretch.
A bright star's light doesn't stop at its core. Through this lens a broad halo, with a core radius of about 90 pixels, holds 7 to 18 % of it depending on color, and green and blue add a scattered-light wing. The first star model stopped at 60 pixels, so the brightest stars left a ring and a teal glow, and a G 3.1 star just outside the frame lit up the left edge.
The new model is physical: the lens's own diffraction core, the scattered-light wing and the broad halo, fitted jointly over the 53 brightest stars, with the saturated ones' brightness set from Gaia. Around 57 Cygni the green and blue excess at 40 to 120 pixels fell from +2.1 and +2.7 ADU to +0.3; the off-frame star's glow is gone; and the light red oval around 57 Cygni stays, because IPHAS shows it too. The saturated cores are filled: red from IPHAS, scaled to ours, where IPHAS covers them, and green and blue following red.
Up close, the texture behind the stars survives
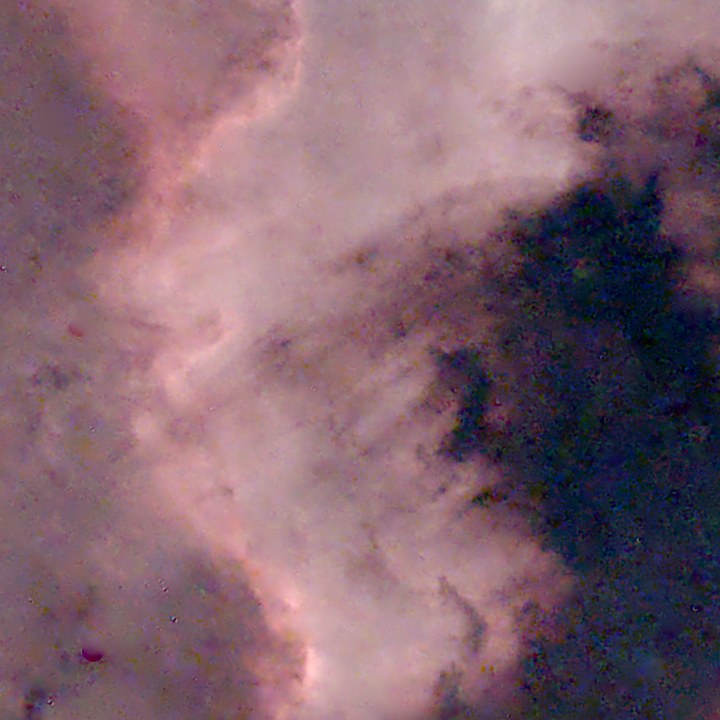
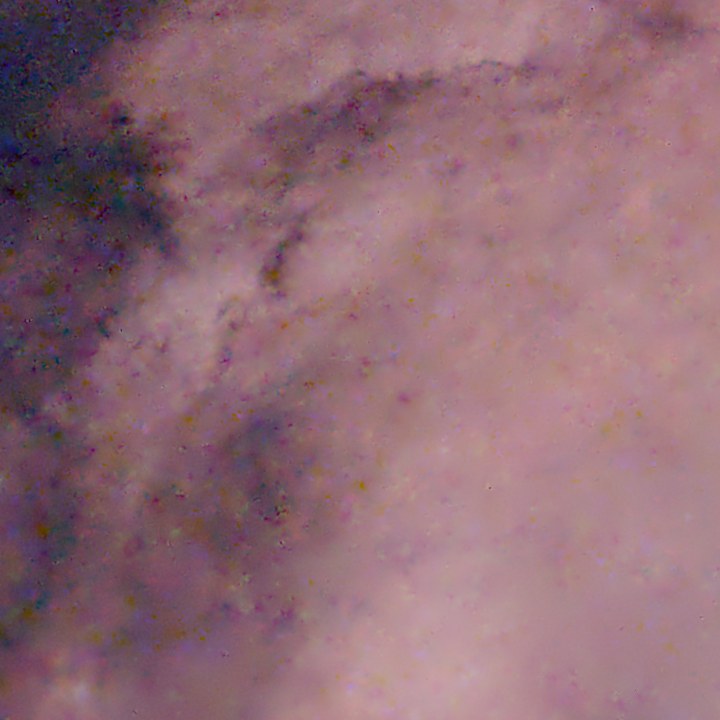
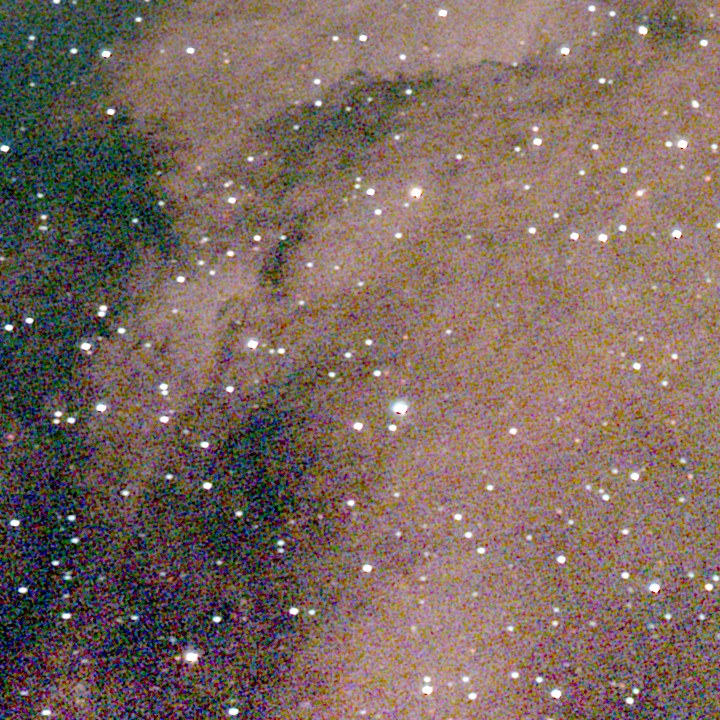
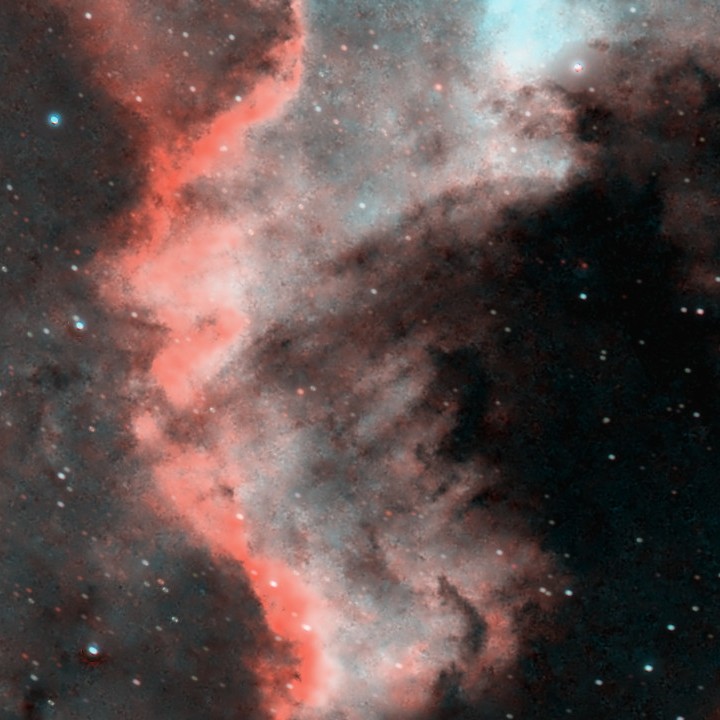
Because each star is subtracted rather than painted over, the filaments running behind it are kept. In a test where I planted fake stars on top of real nebula and took them out again, 98 to 99 % of the nebula's light under them came back. The right-hand sides here are also noise-reduced; the original sides are untouched.
↔
The Cygnus Wall. The ionization front and its dark pillars, at the camera's full resolution (no binning), one stretch for both sides.
↔
Inside the Pelican. Dust lanes and faint glow that the stars were sitting on, one stretch for both sides.
Taking out the grain, and checking what came out
After the stars and the sky glow, a noise-reduction pass takes out the grain. It is a wavelet method: the image is split into detail scales from 1 to 32 pixels, and each detail is kept in proportion to how far it stands above the noise at that spot. Nothing is set by eye. The noise level comes from a null stack: the night split into two halves and subtracted, which cancels the sky and the nebula and leaves only noise. It is scaled pixel by pixel by how many subs covered that pixel, so the thin edges get a higher bar. The pass is deterministic: a second run gives a bit-identical result.
What came out is noise
0.054
Rank correlation of the removed grain with IPHAS, on 16-pixel blocks (0.024 on 4-pixel blocks). At no scale does its variance exceed the null stack's, and it shows none of the nebula's structure.
Structure kept
0.9265 → 0.9476
Rank correlation with IPHAS on fine 4-pixel blocks, before and after. On 16-pixel blocks it barely moves: 0.9507 to 0.9521.
Faint filaments: flux kept, peaks lower
0.95–1.06
Flux kept for nine planted faint filaments (1 to 3 sigma, 1.2 to 3 px wide). Their peaks drop to 35 to 75 %: thin, faint filaments come out fainter and a little softer.
These checks were measured on the first version's stack; the same denoiser runs unchanged on the new one. There, the corners, where fewer subs overlap, ended up nearly as clean as the middle: run through the same pass, the null stack's red noise dropped to 0.21 to 0.26 ADU in the four corners and 0.20 ADU in the center.
The check
Is that wisp real? Ask a survey telescope.
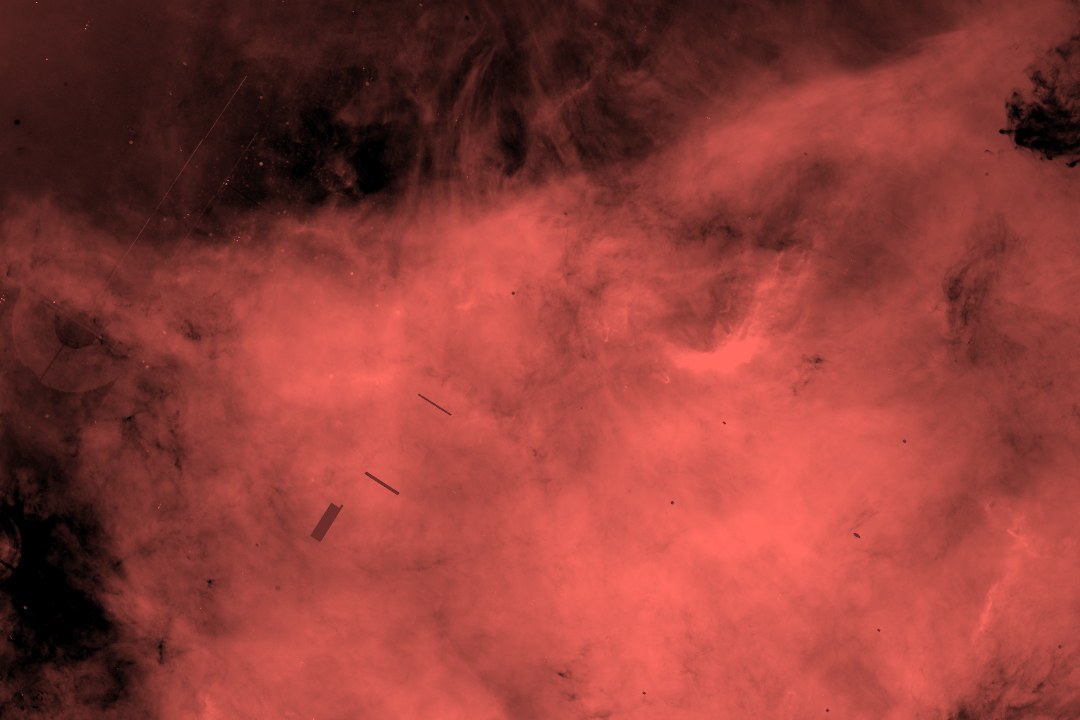
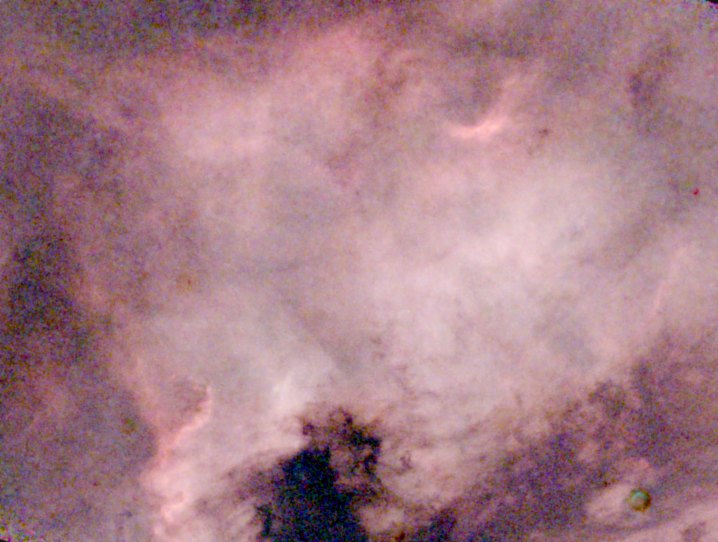
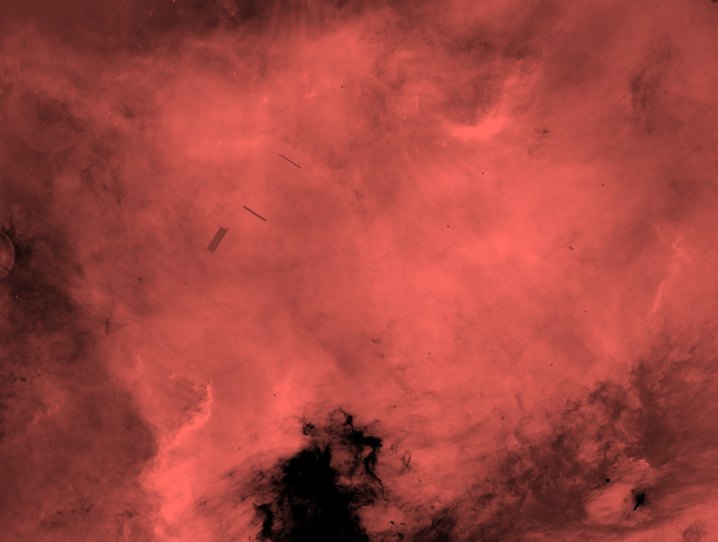
The usual worry with faint nebula is whether a wisp is gas or a processing artifact. IPHAS mapped the northern Milky Way in Hα with the 2.5 m Isaac Newton Telescope. I projected its image into the Seestar's own pixel grid, so the two can be compared pixel for pixel. Drag to compare the Seestar's nebula layer, red channel only (1.5 hours through a 30 mm lens), with IPHAS.
↔Seestar, 30 mmIPHAS, 2.5 m
The nebula's main body, up into the star-crowded Milky Way band at the top. Each image has its own stretch. The dark specks and short streaks in IPHAS are defects in its own survey tiles, not nebula.
Whole frame
0.983
Spearman rank correlation of the red channel with IPHAS on 16-pixel blocks, leaving out only pixels IPHAS doesn't cover. The first version scored 0.95 on the same basis.
Where the data is deep
0.996
Where 500 or more subs overlap and away from filled star cores, with IPHAS's own filled-in star holes and dark artifact blocks left out.
In the star-crowded band
0.56 → 0.78
The crowded top of the frame (12-pixel blocks), with the stars in and with them out, measured on the first version's stack. Taking the stars out uncovered structure that IPHAS also sees.
A second survey, Pan-STARRS1 r, can referee only fine detail (up to 1 to 2 arcminutes; its sky subtraction flattens larger structure). At those scales IPHAS and Pan-STARRS agree with each other better than either agrees with this image, so the remaining fine-scale disagreement is mine, mostly noise. Two more caveats. The sky-glow model was fitted together with a scaled copy of IPHAS, to keep it from mistaking faint nebula for sky; what gets subtracted is only a smooth quadratic surface, so it can shift the large-scale gradient toward IPHAS but cannot put IPHAS's small-scale structure into the Seestar image. And a red channel is not Hα: it also holds [N II] emission and starlight.
A second night sees the same gas
Night 1 (18 September, 195 × 10 s, about 32 minutes) went through the same steps as the first version and was mapped onto night 2's pixels through both nights' plate solutions. The two overlap on 59 % of night 2's frame. This check was made on the first version's stacks and has not been redone on the cloud-corrected one.
Night 2, with stars (sky glow removed)Night 2, starless, 752 subsNight 1, starless, 195 subs, lightly smoothed (0.7 px)IPHAS Hα, own stretch
0.98night 1 vs night 2
0.99night 1 vs IPHAS
0.98night 2 vs IPHAS
Spearman rank correlations on the overlap, 12-pixel blocks, first-version stacks. The three Seestar panels share one stretch and are shown binned 3 × 3.
How the stars come out
Correct each sub for cloud. Scale every sub, color by color, to the clearest part of the night, and drop the cloudiest and softest subs.
Place every catalog star. Each Gaia DR3 star lands at its known position through the frame's plate solution: here 98,258 stars down to G = 17. Fainter stars are not modeled and stay in the image.
Measure the star shape from the same night. The point-spread function comes from this night's own stars, per color, in zones across the field.
Fit one number per star, then subtract. Position and shape are fixed, so each star gets only a brightness. Subtracting a model keeps the books balanced: light the star model doesn't claim stays in the image.
Take the background under each star from the whole session. It comes from a starless template of the session rather than a small ring around the star, so a star sitting on bright nebula doesn't take the nebula with it.
Model the brightest stars' halos. Diffraction core, scattered-light wing and broad halo, with brightness from Gaia, including bright stars just outside the frame. Their saturated cores are filled.
Model the sky glow. A smooth quadratic surface per color, fitted together with a scaled copy of the IPHAS image so the gradient comes out without eating the faint outer nebula.
Take out the grain. The wavelet noise reduction described above, with its noise level set by the null stack, not by eye.
What isn't solved
What's still visible
A thin fringe at the top and bottom
Only about 95 subs overlap along the top and bottom edges, against up to 531 in the middle. A faint bright fringe, about 1 to 2 ADU, survives there. It is not light fixed to the sensor and not the background fitting (both were tested), and part of it is light from the edges of the subs.
Patched cores look flat
The filled cores of the brightest stars, 5.4 % of the frame's pixels in all, carry the right level and the pixel noise but not the texture around them. In crowded dark fields they read as slightly smooth disks. They are cosmetic, not measurements.
Faint-star speckle, and some dark cores
Stars fainter than G 17 are not modeled, and once the grain around them is gone they stand out as speckle, mostly in the star-crowded top band and the dark lanes; that is real starlight. Stars of G 10 to 12 still get their cores slightly over-subtracted, as I expected before rendering.
Star colors after the cloud correction
Star brightnesses improved a lot, but star colors didn't: their scatter against Gaia went from 9.8 % to 11.0 % in red against green. The cloud's color term looks over-corrected, or partly a measurement effect in the green pixels. A gentler color model didn't fix it either.
A filament crossing a star loses about 20 %
When a thin filament runs right through a star, the star's brightness fit absorbs part of it. Broad nebula under a star comes back almost whole (the 98 to 99 % above); thin structure that lines up with a star does not. Noise reduction also lowers the peaks of thin, faint filaments, while keeping their light.
This is the method's own tuning data
Both NGC 7000 nights, and the M 33 night below, were used while the method was being developed, and the halo model's shape was fitted on this image. The agreement with IPHAS is real, but it isn't a test on fresh data. That is why this page is exploratory.
What I tried that didn't help
Deconvolution. Stars came out about 10 % sharper, for 26 to 37 % more grain. At this signal-to-noise the extra detail reads as sharpened noise, so it failed the rule I set before trying it.
A direction-aware noise reduction meant to keep thin filaments sharper. It failed its own pre-written acceptance rule, so the simpler one stays.
Subtracting the faint Gaia stars too (G 17 to 21), predicted from their catalog brightness without fitting. Their brightness was over-predicted by 16 to 20 %, which dug shallow holes; a scaled version was only a marginal gain.
Looking for a sensor pattern behind the leftover bands and fringe. Field rotation spreads any sensor-fixed light so thinly that it can't explain them.
Other per-sub background models (a plane, a fit restricted to well-covered areas, a joint fit with a sky-glow term). None beat the one used here.
Compared with neural star removers
Tools like StarNet and StarXTerminator are one click, and today they handle bright stars, and anything that isn't in a star catalog, better than this does. What the catalog approach adds is different: it is deterministic, every star it removes is a catalog star at a known position, the light it takes out is accounted for star by star, and the result can be checked against an independent survey, as above. The two could also work together.
What your processing software could make of it
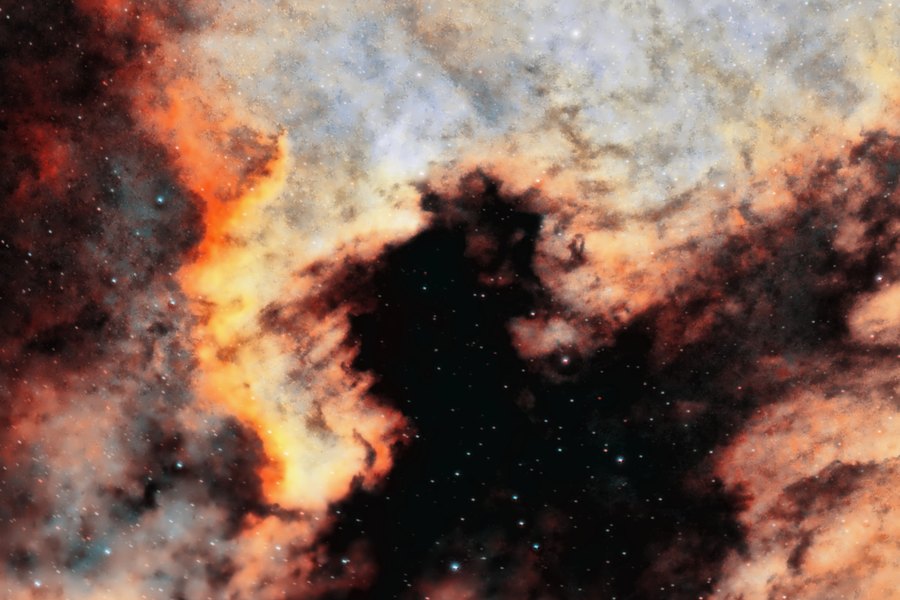
Post-processed for looks An example of what you could do with this data in your own software (Siril, PixInsight, Photoshop). Not a measurement.
Everything above is shown plainly, with one stretch, so it can be checked. Here is the same data processed the way an imager would for a picture: the noise-reduced starless nebula in an HOO palette with a careful stretch, and the real stars put back, smaller.
↔Plain stretchHOO, light hand
Same framing and pixels on both sides. Left: the starless, noise-reduced layer at the page stretch. Right: the same layer post-processed, with the real stars (the stack minus the starless stack, bright-star halos included) reduced and screened back in.
The steps, in imager terms
Background neutralization on the darkest dust, so the dark nebula comes out neutral.
Dual-band channel extraction: Hα from red, [O III] from green and blue. [O III] is boosted to 0.9 of Hα in the bright nebula.
HOO palette: Hα to red, [O III] to green and blue, so the Cygnus Wall goes red and the [O III] glow goes teal.
Color-preserving arcsinh stretch, then curves with a gentle S.
Gentle large-scale local contrast and light sharpening, soft-limited so nothing halos.
Chroma-only noise blur and saturation with a highlight roll-off; no nebula pixel clips.
Stars: a separate gentle stretch (star reduction), screened back at 92 %.
Cosmetic repair, for this picture only: small star-removal pits were filled up to the local median, never above it. The bright-star halos needed no cosmetic repair this time, because the halo model above already handled them. Apart from switching off the tool's own halo repair, the render settings are the same as in the first version; the layers were first scaled to the first version's brightness. No step paints, clones or uses a trained model, and the same input always gives the same output.
People often push this target much further: Foraxx dynamic palettes, synthetic SHO, CLAHE or HDR-style local contrast. I kept to a palette whose colors map to real emission lines (red is Hα, teal is [O III]) and to large-scale contrast only. Heavy local contrast on 1.5 hours of 30 mm data turns faint nebula into a cotton-ball texture that isn't in the sky.
HOO, light hand, real stars reduced and screened back. This is taste. The Cygnus Wall at the camera's full resolution.
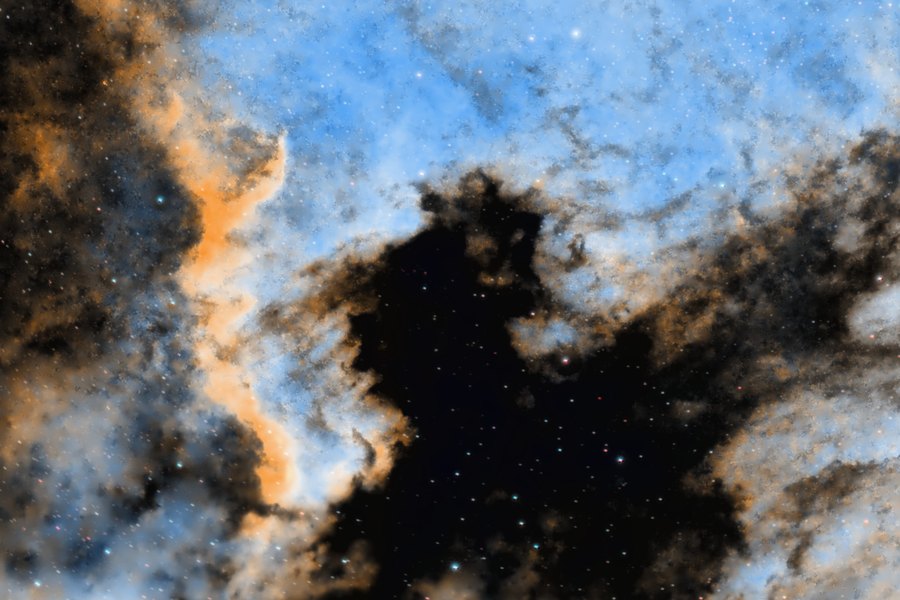
Further: Foraxx dynamic HOO. Hα fronts go gold to orange where both lines are bright. Still two real lines, just a different mapping.Further: synthetic SHO. Synthetic: the S II channel is made up. Dual-band data has no S II, so a stand-in built from Hα fills the red.
The two heavier looks come from a separate editing pass on the first version's stack, with a slightly different framing. Neither is used anywhere else on this page.
The same idea on a galaxy: let the sky turn
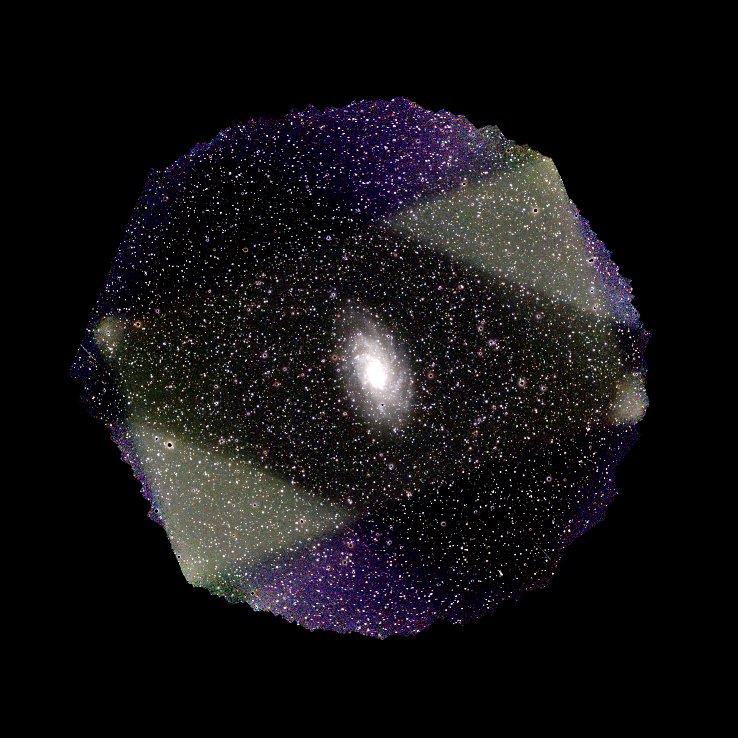
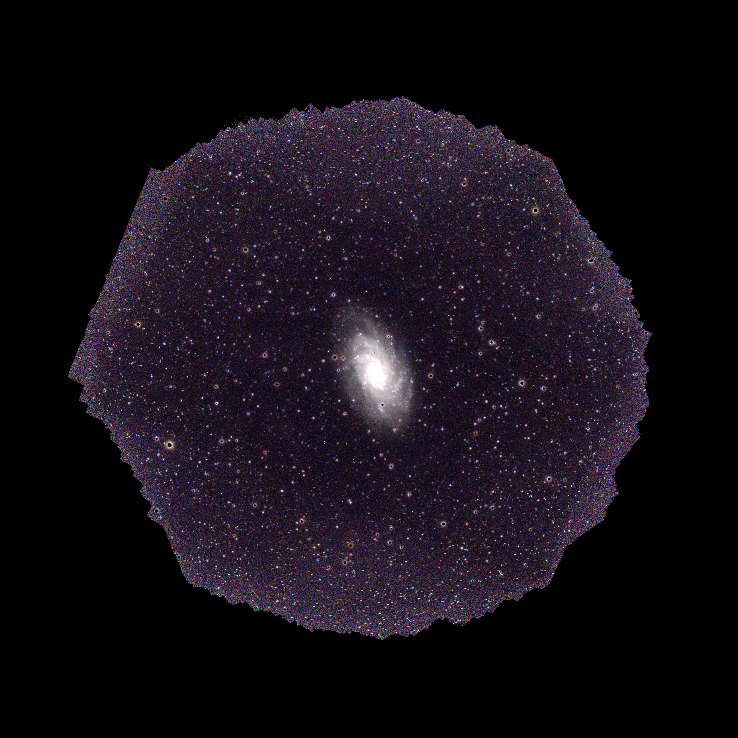
On an alt-az mount like the Seestar's, the sky slowly rotates on the sensor through the night. Over one night of 291 subs on M 33 it turned 140°. Light that turns with the sky is real; light that stays put on the sensor, or changes from sub to sub, is not. One joint fit sorts the night into those layers.
Everything together, including the bright wedges that don't turn with the sky. M 33, one night, 291 subs, Seestar S30 Pro.
The same subtract-what's-known idea is behind two other workbench results that will get their own write-ups. Legacy Survey images of the Leo Triplet, pushed through a model of the Seestar's optics, registered to the Seestar frames to 0.12 px and matched M 66's spiral-arm phase to 1.7°. And a frame-by-frame model of community M 31 frames shows Hubble's Cepheid V1 at 3.2 sigma at its catalog position; whether it can be seen pulsing is not confirmed.
Fixed in advance, and measured
Fixed in advance
Star positions and the depth cut, G < 17, from Gaia DR3.
The reference image: IPHAS Hα, a published survey.
What I expected, written before rendering the first version: the starless red channel tracks IPHAS closely (an earlier check gave 0.92), night 1 repeats night 2's structure, and G 10 to 12 star cores fail.
Cloud correction: how transparency is measured, the reference (the clearest stretch), the smoothing and the cut (0.5 mag of cloud, or stars 1.3 times softer than the night's best), written before any transparency was measured, with two amendments recorded before the restack.
Halo model: its form and its validation bars, written before the fit. Most bars fail as written at the 0.1 to 0.5 ADU level, where nebula texture dominates; 57 Cygni's passes.
Noise reduction: the noise level of every pixel and scale comes from the null stack and the coverage map, not from a slider. The planted test filaments were fixed in the code before any result was seen. The remaining settings were tuned on this frame against these checks.
Measured on these nights
The brightness of each of the 98,258 stars, and the star shape.
Cloud: clear for 1.8 h, then up to 0.91 mag lost, not gray; 532 of 752 subs kept. Star brightness scatter vs Gaia 24/17/22 % to 17/10.5/15 % (R/G/B).
The sky glow: 17.4, 16.7 and 18.8 ADU across the frame (red, green, blue), in the new stack's units.
IPHAS: 0.983 whole frame (first version 0.95), 0.996 well covered; crowded band 0.56 → 0.78 and nights 0.98, 0.99, 0.98 on the first version's stacks.
Halos: 57 Cygni's green/blue excess +2.1/+2.7 ADU to +0.3; the off-frame star's glow from +6.6 to −0.6 ADU (residual against IPHAS).
Nebula recovered under planted stars: 98 to 99 %. Filament light lost under a star: about 20 %. Filled cores: 5.4 % of pixels.
Noise reduction (first version's stack): removed grain vs IPHAS 0.054; denoised vs IPHAS 0.9265 → 0.9476 at 4 px; planted faint filaments keep 0.95 to 1.06 of their flux and 35 to 75 % of their peak.
The post-processed look is neither fixed nor measured: its palette, stretch, contrast and star settings are taste, chosen to look good on this frame, and none of its numbers should be read as a result.
No fresh data was looked at for this page. A confirmation needs a night, and ideally a camera, that the method has never seen, chosen and named before the check is run.
Data and credits
My data: a Seestar S30 Pro with its dual-band light-pollution filter on its alt-az mount. NGC 7000 on 18 and 19 September 2026 (195 and 752 subs of 10 s; 532 of the 752 in the final stack) and one night on M 33 (291 subs). Orientation: north up, tilted 33.4°; 3.66″ per pixel. Every comparison uses one stretch for both sides unless a caption says otherwise. Correlations are Spearman rank correlations on 12- or 16-pixel blocks.
Star positions, magnitudes and spectra: ESA Gaia DR3. Hα reference: IPHAS DR2, the INT Photometric Hα Survey of the Northern Galactic Plane, taken with the 2.5 m Isaac Newton Telescope on La Palma; I built the continuum-subtracted image and projected it into the Seestar frame. Second reference: Pan-STARRS1 r.
 Skycruncher
experiment, Oct 2026
Skycruncher
experiment, Oct 2026