HAT-P-32 b, watched live and measured over the whole night
The short answer
Detected. With the planet's crossing held at its predicted time, the star dimmed by 1.80 ± 0.24 %, 5.1σ against the night's own noise floor measured on the comparison stars. Letting the time float too gives 2.51 ± 0.54 % (4.7σ); the published depth is 2.22 %.
The live view works. Its last update landed 0.4σ from the whole-night depth and 0.2σ from its mid-time, at about 0.15 s of computing per sub.
Don't use the timing. The mid-time came out 19.5 ± 9.9 min early. Published timetables agree with each other to about 2 min, so this is a problem with the stretch of light curve before and after the transit, not a real shift: the sequence started only 12 min before the transit began. The camera clock was checked and ruled out.
HAT-P-32 b is a gas giant that circles its star every 2.15 days. Seen from Earth, it passes in front of the star each orbit, a transit, and blocks a little over 2 % of the star's light for three and a half hours. On the night of 20 October 2026 my Seestar S50, a 50 mm smart telescope at Starfront Observatories in Texas, took 762 twenty-second exposures (subs) through one of those transits.
Usually I measure a transit the next day, from all the subs at once. This time I wanted to see the transit come in as the subs arrived. So the transit software ran in a live mode, measuring each new sub as the observatory's computer uploaded it and redrawing the light curve, and then ran its normal whole-night analysis once the sequence ended. The prediction and every choice that shapes the answer were written down and saved before a single frame was measured. This page reports that record, the whole-night result, and the checks run beside it afterward. No number here was changed after the answer was seen.
Exploratory One night from one telescope. The depth is a clear detection; the mid-time is not usable as a timing.
1.80 ± 0.24 %depth at the predicted time; 5.1σ against the comparison stars' noise floor (sd 0.36 %)
2.51 ± 0.54 %depth with the time free; 4.7σ; published 2.22 %
−19.5 ± 9.9 minmid-time against the Kokori et al. 2023 timetable (−2.0σ): a baseline problem, not a timing
750 / 762subs in the fit: 11 set aside by the night's rules, 1 clipped in the fit
The words on this page
Depth
How much of the star's light the planet blocks, in percent.
Mid-time
The middle of the transit. Ingress is when the planet's disk first touches the star's edge, egress when it leaves.
Timetable (ephemeris)
A published prediction of when transits happen: one observed mid-time plus a whole number of orbital periods.
O−C
“Observed minus calculated”: when the transit happened minus when a timetable said it would, in minutes. Negative means early.
BJD
Barycentric Julian Date (BJDTDB): a count of days timed at the center of mass of the solar system, so the few minutes light takes to cross Earth's orbit don't shift it. Astronomers quote transit times this way.
Comparison stars
Nearby stars of similar brightness whose combined light is the yardstick. Dividing the target by them cancels haze and the star's changing height in the sky. Check stars are three more of the same kind, kept out of the yardstick and measured like the target: they should show no dip.
σ (sigma)
One standard uncertainty. A dip at 5.1σ is 5.1 times larger than its uncertainty; above about 5 counts as a clear detection.
Noise floor (null)
Treat each comparison star in turn as if it were the target, with the same mid-time and fit, and see how big a “dip” it shows. The spread of those fake dips is what this night produces with no planet.
Baseline
The slow drift of the light curve outside the transit, from the sky and the star's height, fitted together with the transit. Airmass is the thickness of air the light passes through, 1 straight overhead.
What was written down before measuring
Saved at 10:02 UTC on 21 October 2026, before any frame of this night was measured. Nobody had looked at this night, so it counts as fresh data: nothing about the method was tuned on it.
The prediction
Timetable in use
Kokori et al. 2023 (smallest propagated error)
Predicted mid-time
BJDTDB 2461334.87345 ± 0.31 min
In UTC
ingress 07:03:28 mid 08:49:59 egress 10:36:29
Duration
213.0 min
Planet size (radius over the star's), depth
0.1489 · 2.22 %
Orbit size (in star radii), tilt
5.34 ± 0.04 · 89.0 ± 0.7°
Limb darkening (the star's edge is dimmer than its center)
u1 0.440 · u2 0.250
Host star
Gaia G 11.13
What I expected, and the outcome
A thin line beside an outcome says how it went: met, partly, missed.
Expected
Outcome
Depth 2.0 to 2.4 % after removing neighbors' light
Partly met: the time-free fit, 2.51 %, is inside only within its error; the fixed-time depth, 1.80 %, is below
O−C within ± 5 min of Kokori 2023
Missed: −19.5 ± 9.9 min
Above 5σ by the end
Borderline: time-free fit 4.7σ; fixed-time depth 5.1σ against the noise floor
The thin stretch before ingress (12 min) is the risk
As expected: it's what happened
Live against final within 1σ
Met: 0.4σ (depth), 0.2σ (mid-time)
The choices, fixed before measuring
The live mode used the transit software's own steps and defaults. Everything that needs the whole night was fixed once, on the catch-up batch: the 429 subs already uploaded when the live run started, 06:51 to 09:34 UTC.
Comparison stars
Gaia stars from 2 magnitudes brighter to 1 fainter than the target, isolated, not flagged variable, with a clean Gaia position fit (RUWE < 2); drop any whose scatter is above 2× the median, repeated until none are; the three closest in brightness held out as check stars; each star weighted by its scatter, no one star above 20 %. Chosen once, then frozen.
Aperture and color
The aperture (the circle of pixels summed around each star) with the lowest frame-to-frame scatter over 8 sizes (0.6 to 3.0 times the star width, FWHM), and the camera's color channels, picked without looking at the transit. Chosen once, then frozen.
Flat and sky
No flat-field correction of any kind (the default). The sky is the clipped median of a ring around each star.
Baseline
No extra corrections: only baselines in time and airmass, picked by the Bayesian information criterion (BIC, a score that rewards a better fit and penalizes extra terms) from a constant, a straight line or a curve, each with and without airmass. This is the software's default and the fixed-time fit's setting.
Bad subs
The software's rule, re-run on everything so far at each update.
Result of record
The software's whole-night analysis with every default (a 3,000-step Markov-chain Monte Carlo run, MCMC, to map the range of plausible fits; a 100-draw bootstrap; 50 comparison-star subsets), run after the sequence ended.
The light curve
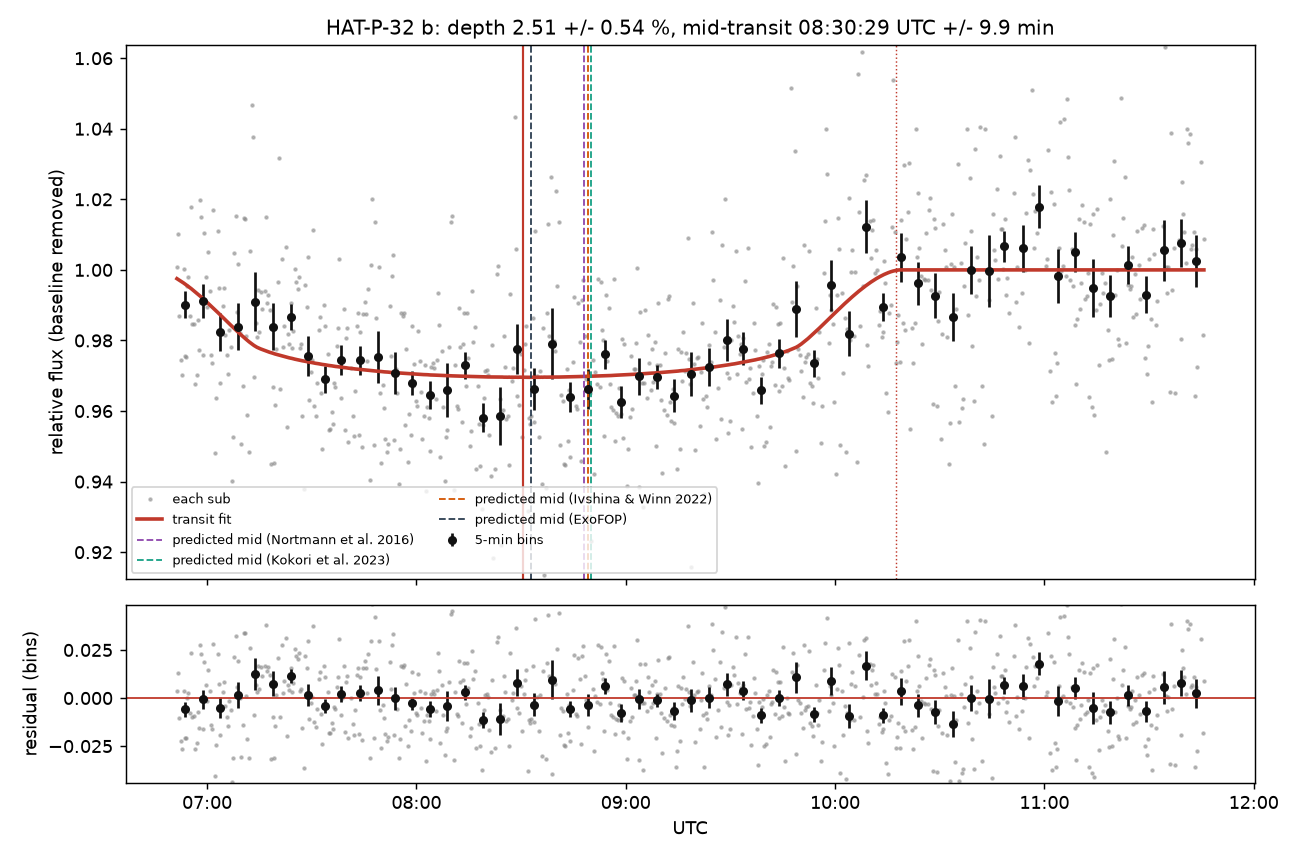
The whole-night fit. Gray points are single 20 s subs divided by the comparison stars, with the fitted baseline removed. Black points are 5-minute averages, and the red curve is the transit fit. Dashed lines mark where the published timetables put mid-transit; the solid red line is where this night puts it. The fit puts ingress at 06:43 UTC, before the first sub, so it rests on the egress and the floor of the transit.
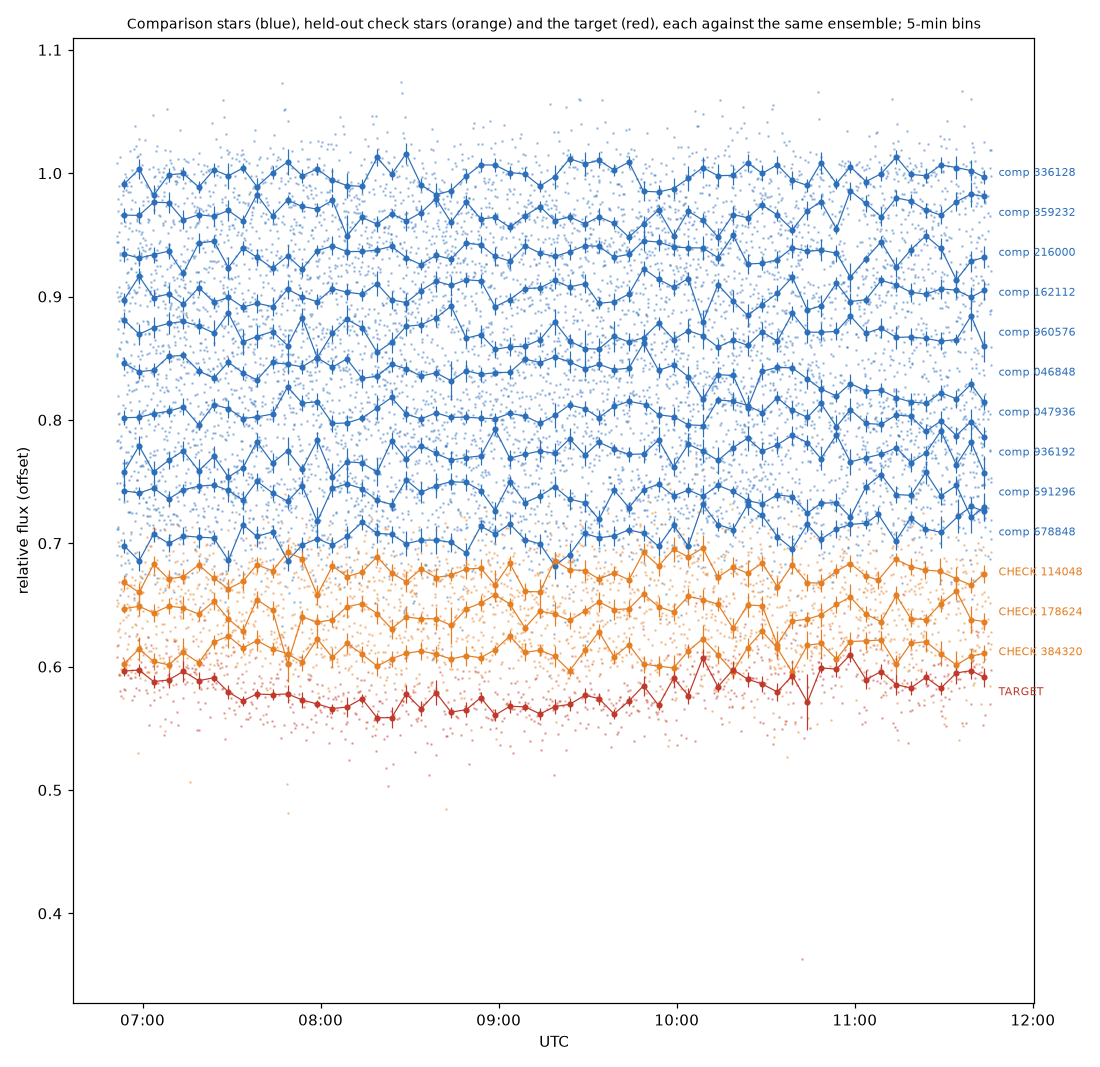
The target against ten of its 19 comparison stars (blue) and the three check stars, all on the same yardstick, in 5-minute averages. The target (red, bottom) dips; the three held-out check stars (orange) stay flat. Their fitted depths at the target's mid-time are 0.00 ± 0.13, 0.01 ± 0.15 and 0.01 ± 0.16 %.
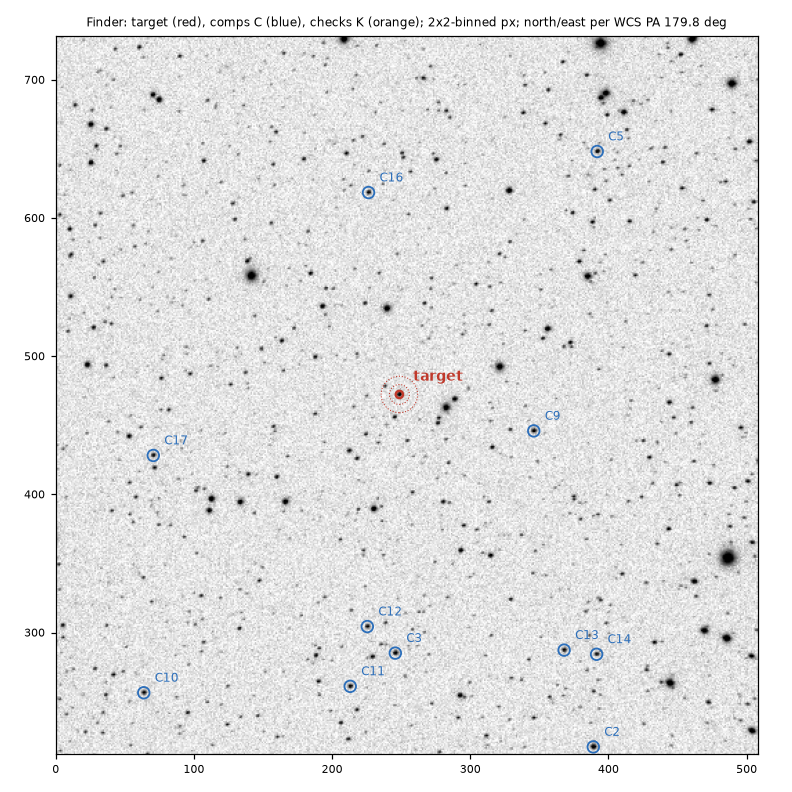
Finder chart: the target in red and the comparison stars in blue, 2×2-binned pixels. 19 comparison stars and 3 check stars were kept out of 38 candidates.
The depth at each published timetable
Here the software holds the published transit shape and mid-time fixed, fits only the depth and a baseline, and does it for every published timetable. Nine of ten land at 1.80 to 1.84 % and 7.5 to 7.7σ by their own errors. ExoFOP's timetable, which sits 17 min earlier with a 19 min error, gives 2.35 %.
Timetable
Predicted mid (BJDTDB)
Depth, fixed (%)
σ
Δχ² vs no transit
O−C of this night (min)
Hartman et al. 2011
2461334.87210
1.84 ± 0.24
7.7
59.2
−17.5 ± 10.9
Nortmann et al. 2016
2461334.87215
1.84 ± 0.24
7.7
59.1
−17.6 ± 9.9
Gibson et al. 2013
2461334.87372
1.80 ± 0.24
7.5
55.6
−19.9 ± 9.9
Zhao et al. 2014
2461334.87301
1.82 ± 0.24
7.6
57.1
−18.8 ± 10.8
Kokori et al. 2022
2461334.87360
1.80 ± 0.24
7.5
55.8
−19.7 ± 9.9
Bonomo et al. 2017
2461334.87298
1.82 ± 0.24
7.6
57.2
−18.8 ± 9.9
Wang et al. 2019
2461334.87360
1.80 ± 0.24
7.5
55.8
−19.7 ± 9.9
ExoFOP
2461334.86150
2.35 ± 0.25
9.5
91.1
−2.3 ± 21.7
Ivshina & Winn 2022
2461334.87292
1.82 ± 0.24
7.6
57.3
−18.7 ± 9.9
Kokori et al. 2023 (in use)
2461334.87345
1.80 ± 0.24
7.5
56.2
−19.5 ± 9.9
Δχ² is how much better the fit gets with the transit than without it. The fixed-time fit at Kokori et al. 2023 also checks against the comparison stars: the spread of their fake “depths” is the night's noise floor (sd 0.36 %), and the target's 1.80 % is 5.1 of those spreads. A transit of the published depth, added to the same stars, came back at 1.00 of its depth. The comparison stars scatter 1.38× wider than their quoted errors. That factor is reported, not applied; with it, the time-free depth error would be ± 0.74 % instead of ± 0.54 %.
The live updates against the whole-night answer
The live mode ran from 10:05 to 12:16 UTC, with a plain least-squares fit only (no MCMC while live). Each update took 3 to 7 min, most of it listing the folder of uploaded subs. The newest sub always lagged: the upload times put the lag at 6.9 min or more, with a 28 min median.
The shaded bands are the whole-night result ± 1σ. On a narrow screen, scroll the chart sideways.
Update (UTC)
Subs
Newest sub
Depth, time free
Mid-time vs Kokori 2023
Against the noise floor
10:09
429
09:34
2.21 ± 0.51 % (4.3σ)
+5 ± 40 min
4.2σ
10:20
458
09:45
2.22 ± 0.27 % (8.4σ)
+4 ± 3 min
4.0σ
10:53
537
10:15
2.68 ± 0.98 %
−7 ± 40 min
4.7σ
11:00
584
10:33
2.86 ± 0.46 % (6.3σ)
−27 ± 9 min
6.3σ
11:30
664
11:09
1.61 ± 0.73 % (2.2σ; baseline became a curve)
−26 ± 9 min
−0.1σ
11:52
707
11:25
2.76 ± 0.44 % (6.3σ)
−21 ± 8 min
5.5σ
12:16, last
762
11:49
2.78 ± 0.46 % (6.0σ)
−22.6 ± 8.3 min
7.7σ (fixed 1.89 ± 0.28 %)
At 11:30 the baseline rule briefly picked a curve (a second-order polynomial), which absorbed the transit (fixed-time depth −0.15 ± 0.95 %). The live and final runs differ only in the frozen comparison stars (28 chosen on 429 subs, against 19 on 762), MCMC, and the bootstrap size.
Why the mid-time came out early
The choices written down in advance stay the result of record: changing the baseline rule after seeing the answer is exactly what fresh-data testing forbids. Everything in this section is reported beside the result, not instead of it.
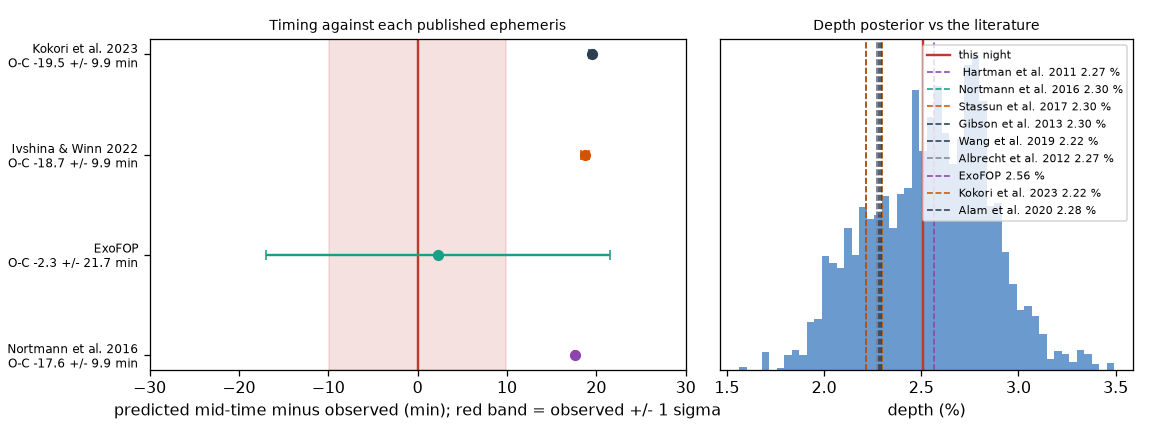
Timing against four timetables, and the range of plausible depths. Left: predicted minus observed mid-time, where the red band is this night's ± 1σ. Right: the MCMC depth distribution against published depths.
Timestamps: not the cause. Exposures run 20.6 s from the start stamp to the end stamp in each file. The software uses the midpoint, the same code that gave an O−C of +0.4 ± 4.2 min on the WASP-12 b night. As an independent clock, each sub's upload time minus its own stamp is never under 6.9 min (638 subs). A camera clock 20 min behind would make that impossible.
The comparison stars: not the cause. The check stars are flat. Dropping each of the five most heavily weighted comparison stars gives −17.2 to −22.9 min. The target against each of the 28 comparison stars alone gives a median of −20.4 min (16 to 84 %: −29.4 to −10.3). The shape is common to every comparison star, so it lives in the target against the field: differential extinction (airmass 1.04 to 1.89) or a position or flat-field term.
The baseline: the cause. The transit fills 213 of the 298 observed minutes, with 12 min before ingress. Any baseline with a slope or curvature trades against the mid-time, and a slope taken from the 78 subs after egress alone gives −10 min.
Re-centering. From 10:43 UTC the Seestar re-centered 7 times. After some of those, 5 to 7 of the 45 stars fell off the S50's small frame.
These timing checks ran on the live measurements (650 subs, the 28 comparison stars the live run chose), not on the whole-night run.
The whole-night fit under each baseline
Baseline
ΔBIC
Depth
Mid-time vs Kokori 2023 (min)
constant
2.3
1.90 ± 0.21 %
−7.2 ± 2.8
constant + airmass
3.7
2.31 ± 0.28 %
−11.6 ± 2.2
straight line (the rule's pick)
0.0
2.48 ± 0.28 %
−18.4 ± 2.9
straight line + airmass
1.4
2.47 ± 0.31 %
−25.5 ± 2.9
curve
0.6
2.26 ± 0.34 %
−27.2 ± 3.5
curve + airmass
6.0
1.36 ± 0.61 %
−26.0 ± 3.2
750 subs. These are least-squares values before MCMC. The headline error of ± 9.9 min adds the spread across baselines within ΔBIC 10 (7.7 min) to the MCMC range and the comparison-star term.
Two alternative runs
Run
Depth, time free
O−C
Depth at the predicted time
automatic extra corrections
2.48 ± 0.50 %
−18.4 ± 8.9 min
1.80 ± 0.24 %, 5.1σ, detected
flat field made from the night's own frames
2.07 ± 0.44 %
−26.5 ± 9.1 min
1.47 ± 0.53 %, 2.7σ, not detected
No MCMC, 20-draw bootstrap. The automatic corrections found nothing worth adding (transparency ΔBIC −4.0 against a −6 bar), so that run repeats the default fit. The self-made flat moved the aperture to 4.35 px, and the baseline score picked a curve.
The night
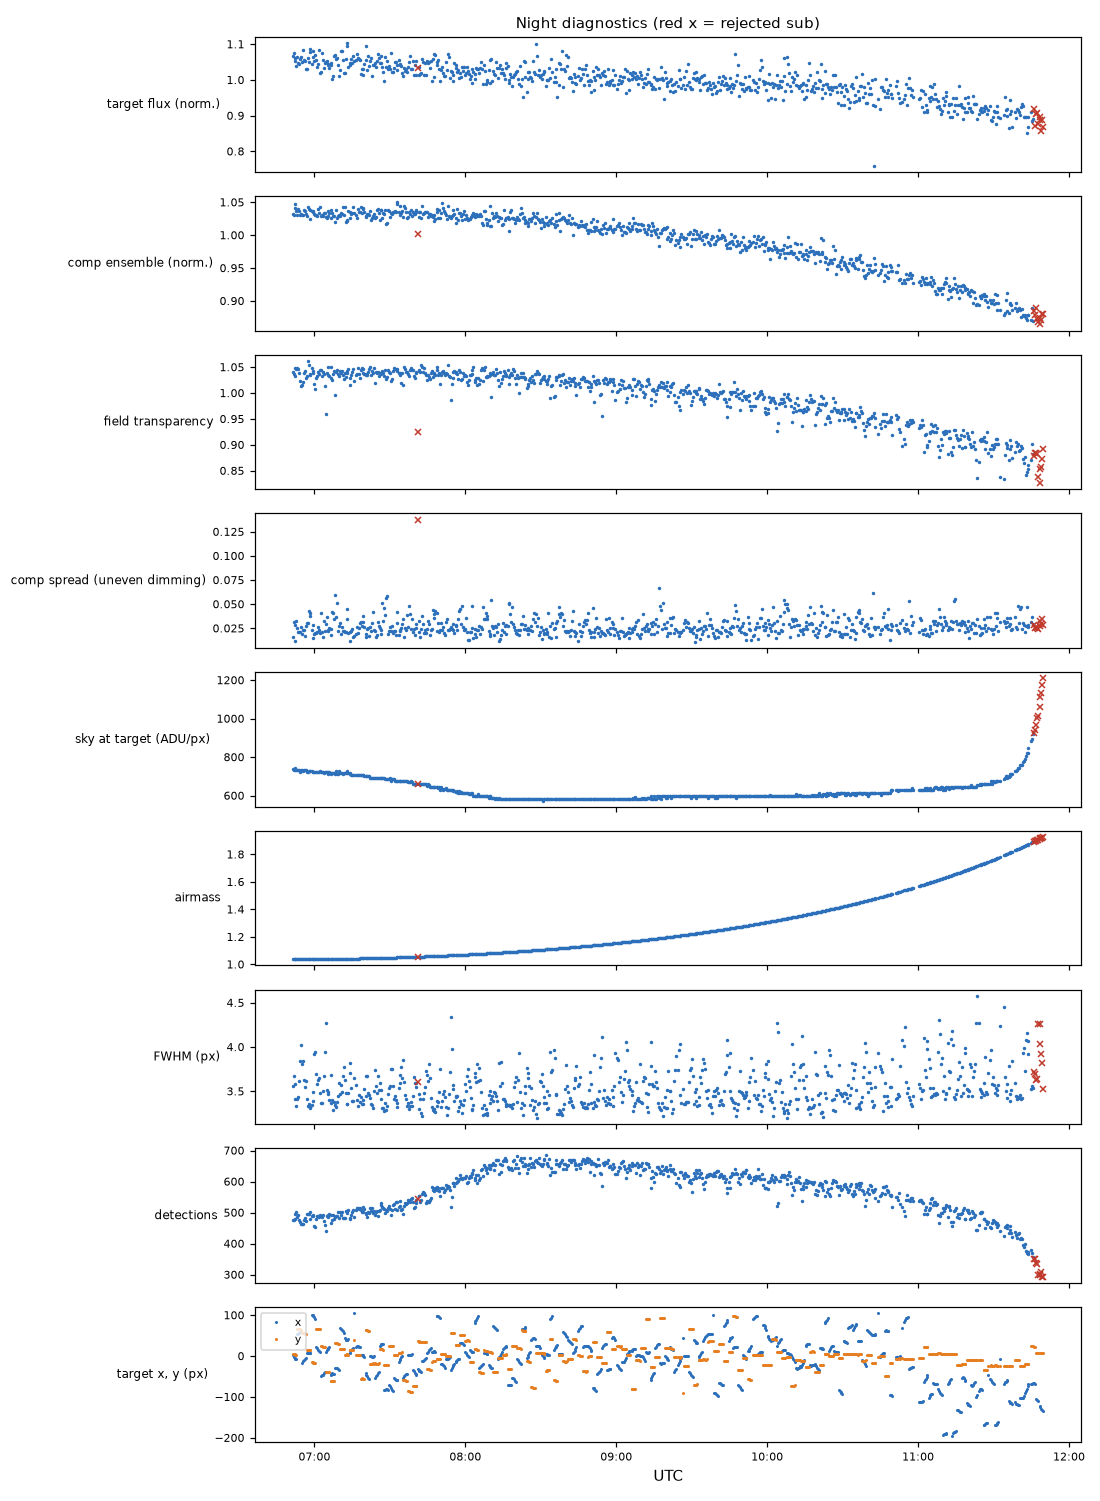
Airmass ran from 1.04 to 1.89, and the comparison stars' combined light fell steadily with it. The software set aside 11 subs: one at 07:41 UTC, where the field dimmed unevenly, and the last ten from 11:46 UTC, where the number of stars detected fell under 60 % of the night's level as the sky brightened at high airmass.
Night diagnostics, per sub. Red crosses are subs set aside. The jumps in target x and y are the Seestar re-centering.
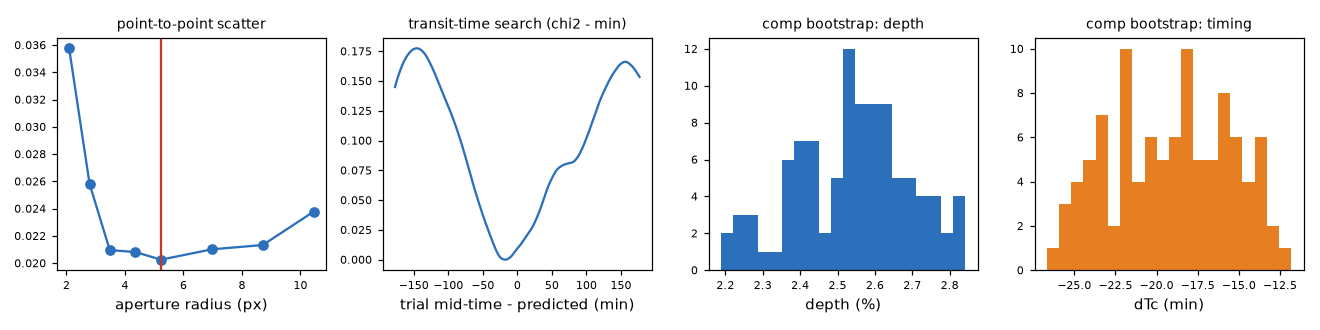
The method checks. Aperture scatter by radius (5.23 px chosen, 1.50 FWHM); the mid-time search over the window; the comparison-star bootstrap (re-running the fit on random subsets of comparison stars) for depth (sd 0.15 %) and timing (sd 3.6 min).
Proposed for future nights
Proposals, not applied to this night.
Cap the baseline's complexity by how much of the night lies outside the transit: no curve without 45+ min outside the transit on both sides, and no slope without 30+ min on one side and 15+ on the other.
Warn when a window leaves under 45 min before ingress or after egress. Our transit planner now warns on short baselines.
An observation, not a rule: the comparison stars' 95 %-on-frame requirement is computed on the catch-up batch, so it can't see re-centering that only starts later and moves stars off the S50's small frame.
 Skycruncher
observing log, 20 Oct 2026
 SkyCruncher