
A thin line beside a passage says how far its claim is proven: measured, tested, planned, inferred. Colored numbers carry the same mark. A passage with no line is stated. How claims are marked.
Where this stands: promising, not validated. Two sessions on one S30 Pro with one phone. The sensor numbers repeat well; the method needs a second phone and a second scope before it counts as a method. The test program isn't published. If you want to shoot calibration frames today, the calibration guide is the page to use.
Why improvise
Calibration frames are the pictures you take to learn what the camera does on its own: bias frames (zero-length, the sensor's offset), darks (the sensor's heat), and flats (an even light, which shows the lens's falloff and any dust). The usual flat calls for a light panel. A Seestar user has something close to one in a pocket: a bright, even, programmable screen.
Used as a plain white light, a phone gives ordinary flats. This test asks for more. Because the screen can draw anything, it can light one part of the lens at a time, which turns a desk into a small optics bench. The goal is to characterize one sensor and one set of optics with what's already in the house, in a run that needs almost no hands.
One finding sets the scope, so it comes first. On an app-shot M 33 night, the Seestar app was already dividing its telephoto subs by a measured flat for this unit: its dawn sky was flat to 0.14 %, and dividing again added a bright-corner bowl of 5 to 6 % (measured). So none of this improves a stack made in the app. It describes the hardware, and it serves frames shot raw.
Three objects on a desk
A computer drives the scope over Alpaca, the open network protocol that astronomy software uses to talk to devices: exposure, gain, filter and the arm. The phone opens the program's page from a QR code and shows whatever it's asked to: white, a dimmed level, a bar, a pattern. It also makes a sound when a step needs a hand.
The odd shape is forced. The scope sends no CORS headers, the permission a browser needs before a web page may read another address, on either Alpaca server version tried (1.2.0-3 and 1.3.1-1) (measured), and Chrome also blocks calls from a secure page to a device on the home network. So a plain web page can't drive it. A small program on the computer serves its own page and talks to the scope outside the browser.
The paper spreads the screen just enough to hide its pixel grid. The blur should be well under a millimeter across a 30 mm aperture, so the patterns survive (inferred). There's a privacy side to the layout too: with the lens pointing straight up, the camera only ever sees a phone and a ceiling.
Why a screen on the lens tells you about the optics
A camera focused on the stars can't focus on something resting on its own lens. So the sensor never sees the pattern as a picture. Every pixel on the sensor sees the whole screen, through its own slice of the lens: a corner pixel looks through a different set of edges and stops than a center pixel does. Each frame is the pattern, weighted by how each pixel views each point of the aperture:
Show enough known patterns and you can solve for V, a map of the pupil (the opening the light actually gets through) at every point in the field. It's a single-pixel camera run backwards: the patterns go into the lens, and each of the sensor's 8.3 million pixels (2160 × 3840) reads one weighted sum.
Colors can share a frame. Draw three different patterns in red, green and blue, then separate them by the sensor's color planes, and one frame does the work of three. Only one color-coded pair has been shot so far: its unmixed fractions landed within 0.004 of the same shapes shot in black and white (measured).
What makes it dynamic
Nothing about a session is fixed in advance except the order of the steps. Phones differ in brightness, nobody puts one down in the same spot twice, and an exposure that suits one screen level clips at another. So the program measures first, then plans the next step from what it found. On the second session:
- It finds the lens. Twelve bars per axis locate the lens on the screen, with a radius of 94 screen pixels. After the phone is turned, it looks first at the mirrored position and finds the lens again at 94. (measured)
- It measures the screen. Full white through the paper read 360,751 counts per second, far too bright for a useful flat, and the screen's brightness followed a power law of 2.175. (measured)
- It sets its own exposures. Screen value 66 of 255 gave a flat of 1.14 s. Value 70 reached clipping in 2.9 s, which sized the ladder. The dim light-pollution filter needed value 248 for a 1.2 s flat. (measured)
- It checks its own assumptions. Check darks had to land within 20 counts of the bias, or the program would shoot the full set of darks. They landed 4 counts under, so it skipped them. A reference flat every 16 frames watches for drift. (measured)
- It adapts to the scope. It picks the gain the Seestar app uses for that model (200 on the S30 and S30 Pro, 80 on the S50) and cross-checks against the camera's frame size. A pause or a phone call holds the next exposure and re-shoots what it spoiled. The S50 path and the pause handling have only run on a simulated scope. (tested)
The checks came from a failure. On 2026-10-09, the first full run of an earlier program shot 221 frames. The bias, darks and brightness ladder were good. The flats were not: a bright room fooled its "is it lit?" check, so they were flats of the ceiling. A saturated frame fooled its "is it covered?" check on the wide camera too (measured). Single-frame checks gave way to references: the program measures the room first, then asks whether the phone changes anything.
The current program passed 69 of 69 checks against a simulated scope at both depths (tested), before and apart from the real runs below.
What runs, in order
The light run takes 191 frames, reference flats included. It's planned at 14.7 minutes, and the second session took 12.9 (measured). Two moments need a hand: setting up, and turning the phone. Everything else the program works out from quick frames, such as when the light has come back.
| Step | What it does | Frames |
|---|---|---|
| Arm up, paper, phone | Turn on Alpaca once in the Seestar app. The program raises the arm until the lens points straight up; keep a hand on the scope while it moves, then lay paper and phone on top. | by hand |
| Bias | Zero-length frames, with the Dark filter in: the sensor's offset and read noise before any light. | 6 |
| Light check | Is the phone the light? Switching the screen to black must remove 90 % of the signal, twice, or room light would be counted instead. | 4 |
| Find the lens | A bright bar sweeps across the screen, 12 positions in x and 12 in y. Where the signal peaks is where the lens sits under the phone. | 24 |
| Set the level | Dim the screen until a flat needs at least 1 s, which outlasts the screen's flicker. | 4 |
| Ladder | Pairs of flats from 2 % to 120 % of the clip level: gain, read noise, linearity and where the sensor clips. | 26 |
| Color | Solid red, green, blue and white, through the IR-cut filter: how the phone's colors land in the sensor's color planes. | 9 |
| LP filter | The same light through the light-pollution filter: how much it passes, its flats, and red-only and cyan-only flats for its two bands. | 33 |
| Patterns | Halves of the lens and five small disks, each as a pair. Only the deep run adds the Hadamard set below. | 19 |
| Turn the phone | A half turn on the paper, then the lens is found again and the halves and disks repeat. What turns with the phone belongs to the phone; what stays belongs to the scope or the paper. | 47, one touch |
| Blink | The screen flashes at a known rate. The stripes it leaves give the sensor's readout time. | 5 |
| Darks | The Dark filter goes in and the screen goes off; the phone can stay where it is. Check darks and darks for the flats. Then the arm folds itself. | 14 |
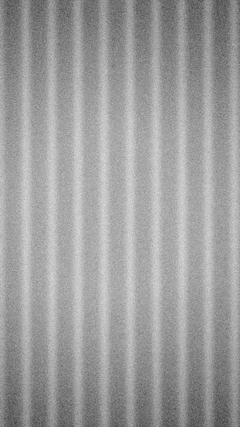

Real frames from the second session, binned down and stretched for the screen, each on its own scale, so their brightness can't be compared (measured).
Phones dim by pulsing their screens, and a sensor that reads out line by line catches each pulse as a stripe. The stripes repeat every 234 pixels (the same in both sessions). At the measured 17.8 µs per line, that's 240 Hz: twice the phone's 120 Hz refresh, so two independent numbers agree (measured). Longer exposures average them away, which is why every flat here runs a second or more.
What the sensor said
The gain here is how many electrons each count stands for, and a count (ADU) is the unit the camera records. Light arrives in random packets, so its noise grows with its signal, and the slope of noise against signal gives the gain with no reference to anything else. That is photon transfer, and it needs only pairs of flats at rising brightness.
| Quantity | Filter | Session 1 | Session 2 |
|---|---|---|---|
| Gain, e⁻ per count | IR-cut | 0.0591 to 0.0596 | 0.0588 to 0.0595 |
| Gain, e⁻ per count | LP | 0.0587 to 0.0592 | 0.0586 to 0.0595 |
| Read noise, counts | Dark | 17.7 to 17.9 | 17.9 to 18.0 |
| Read noise, electrons | Dark | 1.05 | 1.06 |
| Black level, counts | Dark | 1111.5 to 1112.1 | 1112.3 to 1112.9 |
| Worst linearity error, 5 to 80 % of clip | IR-cut | 0.36 % | 0.20 % |
| Readout, whole frame | IR-cut | 38.4 ms | 38.4 ms |
| Flat, corner over center | IR-cut | 0.946 / 0.951 / 0.944 | 0.946 / 0.951 / 0.945 |
| Flat, corner over center | LP | 0.941 / 0.952 / 0.942 | 0.939 / 0.952 / 0.940 |
| LP light as a share of IR-cut light, phone white | LP vs IR-cut | 7.0 % | 5.4 % |
| Flicker bands near 1 s | IR-cut | 0.06 to 0.07 % | 0.05 % |
| Drift of the light over the run | IR-cut | 0.29 % in 26.6 min | 1.01 % in 6.4 min |
| Red + green + blue screen vs white, worst plane | IR-cut | 4.5 % short | 1.4 % short |
| Dark current at about 31 °C | Dark | not shot this way | 0.57 e⁻/s |
The gain repeats to better than 1 % on new frames, and it's the same through both filters, as a property of the sensor should be. Raw frames clip hard at 65,520, the top code of a 12-bit converter written into 16 bits, and only every 16th count value occurs (measured). The two that moved both involve the light source, not the sensor: how much of the phone's white passes the LP filter, and how much the light drifted. Neither has been explained yet.
| Gain setting | e⁻ per count | Read noise, e⁻ | Black, S1 / S2 | Read noise, counts, S1 / S2 |
|---|---|---|---|---|
| 0 | 0.614 | 6.7 | 1002 / 1002 | 10.9 / 11.0 |
| 80 | 0.246 | 4.9 | 1065 / 1066 | 19.8 / 19.9 |
| 200 | 0.0594 | 1.05 | 1112 / 1112 | 17.8 / 17.8 |
| 300 | 0.018 | 0.86 | 1453 / 1455 | 47.8 / 48.2 |
Read noise falls almost fivefold between gains 80 and 200, and barely after that. That shape would fit a sensor switching to a quieter readout mode somewhere between them, but four gains can't place a switch, and nothing here has tested for one directly (inferred).
What the patterns said about the lens
- The patterns behave like a mask on the aperture. In session 1, the 32 Hadamard frames gave the same left-right and top-bottom splits as separately shot halves, to 0.02 %. That's repeatability, because the codes include the halves. Summed over the aperture, the maps rebuild the flat's coarse shape to 0.3 %. (measured)
- The corner falloff looks like a stop, not a smooth curve. Near the ends of the frame's long axis, the split of light between the two halves of the lens leans about 6 % to one side in both sessions, and in session 1 the center of the pupil map shifts by about 0.6 mm. That's the shape expected from a beam walking off a stop away from the lens, at twice the predicted size. (inferred)
- A dim spot that didn't stay put. Session 1 found one offset disk reading 11 % low, the same across the field, so it sits at the aperture. That spot didn't come back in session 2. The largest difference there was 5.5 % between two other disks. (measured)
- The half turn did its job. Turning the phone splits each difference into a part that turns with the phone and a part that stays. Session 2's 5.5 % stayed, with only 0.5 % turning. So it belongs to what stays put: the lens or the paper, which this can't yet separate. (measured)
- One loose end. The two halves should add up to the whole lens. In session 1 they did, within 0.7 %. In session 2 they add to 1.04 to 1.05 of it. It isn't explained yet. (measured) The first suspect is the screen's power law, measured once and used to scale every pattern's brightness.
Predictions, written down first
Before session 2, its expected results were written down, so the session could miss them. The table scores them against the session's quick analysis. The misses are the useful part.
| Prediction | Result | Scored |
|---|---|---|
| Gain at 200 within 2 % of 0.0594 | 0.0592 | Hit |
| Readout within 2 ms of 38.4 ms | 38.41 ms | Hit |
| IR-cut flat, corner over center, within 0.003 of 0.946 | 0.945 to 0.947 | Hit (green) |
| Lens radius within 3 % of 93.7 screen pixels after the turn | 94.3 × 93.6 | Hit |
| Check darks within 20 counts of bias | −4.3, −4.1 | Hit |
| Red and cyan band flats match each other within 0.01 | at most 0.0095 apart | Hit |
| Red-only through LP: red plane holds at least 80 % | 69.6 % | Miss |
| Cyan through LP: red plane under 10 % | 13.9 % | Miss |
| The 11 % dim spot turns with the phone (a 60 % lean) | not seen again | No score |
Raw frames and app frames, kept apart
Every number above is on the raw route: frames over Alpaca, with no white balance, no flat and no dark taken off. A sub saved by the Seestar app (the app route) has had the app's dark subtracted, been multiplied by a white balance and divided by the app's flat, and had a pedestal added back. Raw frames clip hard at 65,520. In app subs on firmware 8.46, green stops softly lower, about 55,500 at the center of the frame and varying across the field, while red and blue reach 65,535 (measured).
So a raw number can't be used on an app sub as it stands. Dividing the raw gain by the app's white-balance multiplier gives an estimate at the center of the frame, and it differs by filter, which is why filter results stay separate here. Green is about 0.072 e⁻ per count through either filter; red is 0.050 through LP and 0.042 through IR-cut; blue is 0.043 and 0.039. Those multipliers were fitted on firmware 8.46 nights and the gain was measured on 9.31, so whether they carry across is still an open question (inferred).
What it's meant to give
- Vignetting geometry: which stop clips the beam where, in place of one smooth falloff curve. (planned)
- Decentering: whether the optics sit off-axis, from how the pupil map shifts across the field. (planned)
- Transmission across the aperture: coatings, smudges and the filter, point by point. (planned)
- Dust heights: a shadow that moves as the light moves sits above the sensor, and how far it moves gives its height. (planned)
- Hot and warm pixels from the darks and the ladder, mapped per scope. (planned)
- Phone and sensor color: across many phones and many scopes, a joint fit could separate each phone's colors from each sensor's, the way surveys calibrate overlapping fields. Learning a phone's white helps pin down what the sensor is seeing. (planned)
None of those are delivered results yet. The gain, read noise, linearity, clip level and readout are the part that's already measured.
What it still needs
- A full deep run on the same scope and phone, for the colors through the LP filter and the other gains. (planned)
- A second phone and a second scope. Until then, a pattern result could be a quirk of this phone or this unit. (planned)
- A separate check of session 2's analysis, the disks and the halves first. (planned)
- Live tests of the pause and phone-call handling, so far run only on the simulated scope. (planned)
- A way to use the numbers: today they sit in the test's own output, and a reader that brings them into SkyCruncher's per-scope profile is planned. (planned)
Where these numbers come from
- Session 1 (2026-10-13): test program 0.2.0, firmware 9.31 (read in the Seestar app), Alpaca server 1.3.1-1, 505 frames in 40.0 minutes with no pauses or re-shoots.
- Session 2 (late on 2026-10-28): test program 0.4.2, Alpaca server 1.3.1-1, 191 frames at light depth with no pauses or re-shoots. The session's files don't record the firmware. A deep run started right after it stopped at 60 frames.
- The optical and app-route findings: M 33 app subs and Alpaca flats from 2026-09-18 and 2026-10-09; app white balance fitted on NGC 7000 and M 31 nights from September 2026.
- The test only covers the telephoto camera. Wide-camera results are not part of this Note.
- More on calibration: the calibration guide, and the math in How calibration works.