 Skycruncher
sky note, 11 Oct 2026
Halfway through a night on the North America Nebula, thin high cloud drifted over my Seestar and the stars faded. I wanted to know whether the faint cloud did anything besides dim them. It did: the cloud spreads each star's light into a soft glow about 7 arcminutes wide at half brightness (a quarter of the Moon's width), and a big nebula gets that spread light back from its own neighborhood. So after you correct a cloudy frame for how much its stars faded, the nebula comes out too bright: by about 8 to 10 % when the stars are at 60 to 75 % of their clear brightness, and by 22 to 29 % when they are at 35 to 48 % measured. The shape of the glow says the cloud was made of ice crystals roughly the width of a human hair inferred.
On 732 ten-second Seestar S30 Pro subs of NGC 7000 (LP filter, one night, starlight transmission t from 0.30 to 1.09 of the clear-sky value), the nebula's brightness relative to its stars rises linearly in 1/t: E = k (1/t − 1) with k = 0.170 ± 0.003 (R), 0.205 ± 0.003 (G) and 0.161 ± 0.005 (B), intercepts within 0.01 of zero measured. The extinction is gray (ln tR / ln tG = 0.965, ln tB / ln tG = 0.988). The scattered light around ξ Cyg is flat to about 2′, half that at about 3.5′ (full width at half maximum about 7′) and a tenth by 8 to 9′. Of three shapes, Fraunhofer diffraction by opaque disks with a log-normal radius distribution (median radius 43 μm in G, 46 μm in B) fits best by a relative-weight misfit, a Henyey-Greenstein function needs g = 0.999 to come close, and a single power law can't bend enough measured; reading the fit as ice crystals is inferred. The forward peak holds 0.29 to 0.31 of the light removed from the stars, where pure diffraction by large particles holds 0.5.
How sure each claim is: measured from my own frames · stated by someone else, not tested by me · inferred fits my data, not tested directly · illustrative a worked example, not a measurement
I imaged the North America Nebula (NGC 7000) in Cygnus on the night of 19 to 20 September 2026 with my Seestar S30 Pro, a 30 mm smart telescope, through its light-pollution (LP) filter, in 10-second exposures. Each exposure is a sub; the telescope adds hundreds of them into the final picture. For the first 1.7 hours the sky was clear and the stars held steady. Then they started fading, on and off, for the rest of the session, which ended at about 09 UTC measured.
The weather record explains why. Weather services rebuild each past hour's weather from all the observations they gathered, and that reconstruction (the ERA5 reanalysis) shows high cloud over my site going from 8 % to 100 % between 05 and 08 UTC, with no low or middle cloud at all stated. High cloud at that height is cirrus, made of ice crystals. The air near the ground was dry (27 to 38 % humidity, 14 to 18 °C above the dew point), so this wasn't dew on the lens stated. The weather model's own forecast for that night never showed more than 9 % cloud stated.
Seestar S30 Pro, LP duoband filter, 10 s subs, NGC 7000, 04:32 to 08:58 UTC on 20 September 2026: 906 plate-solved subs. Star transparency T is each sub's green zero point against the night's median, T = 100.4 (zp − median); the clear ceiling Tc = 1.152 is the median over the first 1.7 h, a plateau at T 1.1 to 1.25, and t = T / Tc is the direct transmission. I checked T against differential photometry of 174 isolated Gaia stars (G 7.5 to 11.5): r = 0.990, slope 0.957 measured.
ERA5 hourly cloud at the observing site: high cloud 4, 8, 41, 73, 100 and 100 % at 04 to 09 UTC, low and mid cloud 0 throughout; 2 m temperature 7 to 10 °C, dew point −6 to −8 °C stated. The archived operational forecast for the same hours shows at most 9 %. The Moon (63 % lit, 78° from the field) set at 07:20 UTC, so the first cloudy hour was moonlit.
Sample: 732 of the 906 subs. The other 174 were not in the copy of the raw frames I analyzed; they are mostly the cloudiest (median T 0.31, t 0.27). So everything below covers t from 0.30 to 1.09, not the thickest cloud of the night.
The usual way to deal with a cloudy sub is to scale it up until its stars match a clear one: if the stars are at half brightness, multiply the whole frame by two. That assumes the cloud dims everything by the same factor. I tested that on every usable sub of the night: I fitted each sub's nebula against the clear-sky picture of the nebula, divided by how much the stars had dimmed, and compared with the clear subs.
The nebula comes out too bright, and the cloudier the sub, the more so. The chart's horizontal axis is spaced so that a simple theory of forward scattering, written down before I looked, would draw a straight line. The points fall on straight lines that start at zero on clear subs, in all three colors measured. With the stars at half brightness, correcting by the stars over-brightens the nebula by about 15 to 20 % illustrative, worked out from the fitted lines.
Model, written before any image was measured: a thin layer of direct transmission t and single-scattering albedo ω images every source as I = t (S ∗ h) + ω (1 − t)(S ∗ φ ∗ h) + sky, with h the optics' own PSF and φ the phase function. A star's small-aperture flux, which is what the zero point measures, keeps only t. An extended source keeps t plus ω fn (1 − t), where fn is the share of φ that lands back inside the scale on which the source is measured. Normalized by the stars and by a clear sub, the excess is
E(t) = ω fn (1/t − 1) = ω fn (Tc/T − 1),
linear in 1/T through zero, and gray if the particles are much larger than the wavelength. Per sub, I fitted real = degree-2 surface in the sensor frame + γi × (the clear image) over the sky cells away from bright stars, and set Ei = (γi / Ti) over its clear-plateau median, minus 1. Straight-line fits over the 732 subs give slopes 0.170 ± 0.003 (R), 0.205 ± 0.003 (G), 0.161 ± 0.005 (B), intercepts −0.000, −0.006, −0.009, residual scatter 0.038 to 0.055 per sub measured. The slopes are formal least-squares errors; sub-to-sub correlations (the cloud's patchiness, the moonlit first hour) are not in them, so they understate the true uncertainty.
The slope I wrote down in advance was 0.17 ± 0.07, from the 12 % shortfall of three cloudy subs against three clear ones in simulated, cloud-free copies of six subs of this same night (rendered with each sub's own star transparency and no cloud term). Those six subs are among the 732, so meeting it is a consistency check on one night, not an independent test. A second estimator, regressing a sky-fixed intercept map on the slope map with the two halves of the night crossed, gives ω fn 0.186 (R) and 0.169 (G); in B that map method fails (0.03), because the cell-level slope map there is dominated by holes at the bright stars and by noise, so the per-sub fit is the B number.
Why would cloud brighten a nebula? Because thin cirrus doesn't just block light. Each ice crystal is much bigger than a wavelength of light, and light passing its edges bends slightly, a process called diffraction. Most of that bent light travels on almost in the same direction, just a few arcminutes off (an arcminute, 1′, is a sixtieth of a degree; the Moon is about 30′ wide). It's the same effect that puts a colored ring, a corona, around the Moon on a hazy night.
For a star, the bent light lands in a soft glow around it, outside the small circle where software measures the star, so the star reads fainter. For a nebula that is far bigger than the glow, light scattered out of each patch is replaced by light scattered in from the patches around it, so the nebula keeps part of it. Divide by the star dimming and the nebula comes out too bright.
I measured that glow around the brightest star in the field, ξ Cygni (xi Cygni), by comparing every part of the sky around it across all the subs as the cloud came and went. The glow is flat out to about 2′, falls to half by about 3.5′ and to a tenth by 8 to 9′, and it is about 30 times brighter at 5′ than the telescope's own built-in halo around the star measured. The width of a diffraction glow depends on the size of whatever bends the light: bigger crystals, narrower glow. This one fits crystals with a median radius of 43 to 46 micrometers (μm, thousandths of a millimeter), so about 90 μm across, roughly the width of a human hair inferred.
Profile: from 22″ to 7.8′, each sub's pixels around ξ Cyg (G 3.1) minus that sub's background surface at the star, regressed on T per radius bin and per sky sector; beyond 5′, the intercept of a sky-fixed 58.7″ grid (per cell, value = a + b T + a per-sub degree-2 surface in the sensor frame, solved by alternating least squares; the field turns 134° during the night, which separates sky-fixed from sensor-fixed patterns), with the nebula's share k b removed. q = a / (F0 Tc) is the scattered light per unit of lost starlight, F0 the star's 37″ flux at T = 1 from the ensemble zero points with a color term (about 15 % uncertain at G 3). The cloudy-minus-clear group profile matches the T regression.
Fits over 0.6′ to 60′, each with a free constant (the zero level) measured:
The fits weight each point by 1/|q| (relative errors), not by a noise model, so the misfits rank the shapes but are not χ2 probabilities. The radius comes from a grid search (61 radii between 10 and 1,000 μm, σln 0.3, 0.5 or 0.8) without a formal error; 43 and 46 μm are neighboring grid steps. The disk model gives an equivalent projected size: real cirrus crystals are columns, plates and aggregates, so read it as the size scale of the forward peak, not a crystal census. In red the same fit gives 17 μm and albedo 0.65, because ξ Cyg sits at the edge of the Hα nebula and the red profile carries nebula light beyond about 5′; I don't use it.
Two levels predicted in advance from a 1/θ2 guess held: on a sub at T = 0.6, 16 ADU per pixel at 2.4′ (predicted 15) and 0.6 ADU at 12′ (predicted 0.7) measured. The shape did not: I expected a power law with index −2 to −3, and found a flat core to 2′ and a fall steeper than −3 beyond 8′. The optics' own halo (b + a/Tc at the star) is about 30 times lower at 5′. The fifth-magnitude stars' inner profiles have the same shape, 1.5 to 3 times higher in level (their F0 and the nebula around them are less certain). Deneb, 1.3 to 4° off the frame, is below the zero level.
Fine haze and smoke dim blue light more than red, which is why sunsets are red. Ice crystals much larger than a wavelength dim all colors almost equally, so they look white or gray. I measured the dimming in each color from about 100 stars per sub: red, green and blue faded together, within about 3 % down to 40 % of clear; in the cloudiest group, only 7 subs at about a third of clear, red was 8 % off measured. Fine haze would have put red 30 to 40 % off illustrative. That is what a cloud of large crystals should do, and it argues against haze as the main cause inferred.
One thing didn't come out equal: the nebula's extra light grew about a fifth to a quarter faster in green than in red and blue, more than the 10 % I allowed in advance measured. I don't know why; the nebula looks different in each color, so the share of the glow it gets back may differ too inferred.
Ensemble photometry of 174 isolated Gaia stars (G 7.5 to 11.5; a median of 100 measured per sub, over 751 subs) in four apertures, each star against its own clear-plateau median: ln tR / ln tG = 0.965 and ln tB / ln tG = 0.988 in the 37″ aperture measured. With the LP filter, red pixels see mainly the 656 nm window and green and blue pixels the 495 to 501 nm window, so R against G is the real color test and B against G is weak by construction. For aerosol haze with an Ångström exponent of 1.3, ln tR/ln tG would be (656/501)−1.3 = 0.70; for Rayleigh scattering 0.34 illustrative. Little light moves from a 37″ to an 88″ aperture under cloud: the 88″/37″ flux ratio grows by 2.7 % (G), 5.4 % (R) and 4.0 % (B) per unit of (1/t − 1), consistent with a glow that is nearly flat over arcminutes.
The advance expectation was slopes of E equal within 10 % and per-color transparencies equal within 3 %. The slope test missed clearly: G's slope is 21 to 27 % above R's and B's, many times the formal errors. The transparency test missed narrowly: R's extinction differs from G's by 3.5 %. The extinction difference is far from haze-sized (haze would give 30 %); the slope difference is unexplained, and may come from the nebula's different structure in Hα and [O III] changing fn inferred. In the cloudiest group (7 subs, t about 0.32) R/G is 1.08.
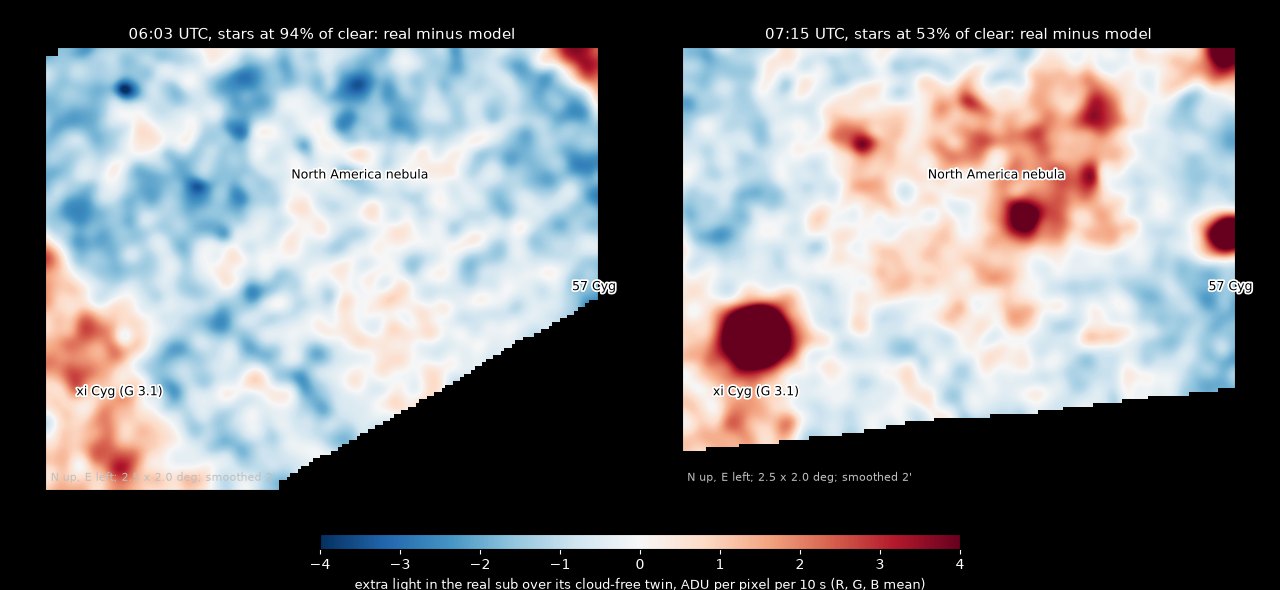
If the glow I measured around one star is really what the cloud does, the same glow spread around every star and every patch of nebula should account for all the extra light in the cloudy subs. I tested that by splitting the night in two halves, measuring the extra light in one half and predicting it from the other. The prediction follows the real pattern well (a correlation of 0.82 to 0.89 in red and green after light smoothing, 0.63 in blue) measured, but only after two scale factors were fitted, one for the nebula and one for the stars: the glow I measured within 15′ of the star needs to be multiplied by about 1.3 to 1.5 for the nebula and 1.1 to 1.4 for the stars to match measured. So the shape fits, and the amount is set by the data, not predicted.
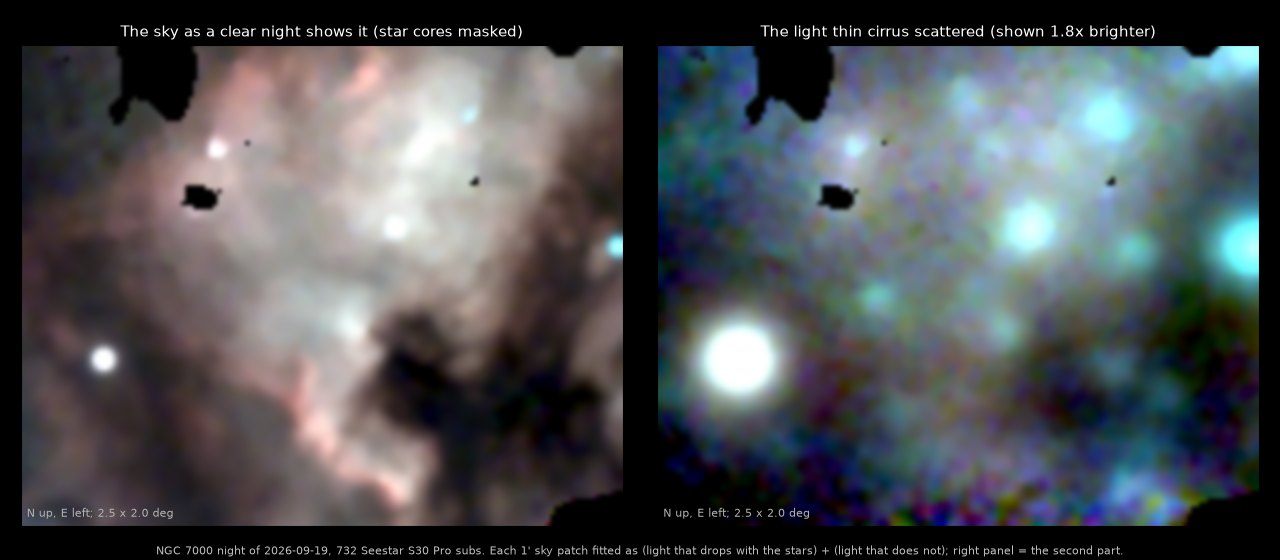
The picture below shows the split directly. On the left is what a clear sub sees. On the right is only the part of the light that stays when the stars fade: the cloud's own contribution. It is a round glow on every bright star plus a soft copy of the nebula with its fine detail blurred away.
Closure test: the intercept map of one half of the night, a = c + plane + α (K ∗ (Tc b + a)) + β (K ∗ Gaia G < 15 star cores at Tc F0), with the nebula and star templates from the other half and K the ξ Cyg glow out to 15′ (G's kernel used for R). Both α and β are fitted, in-sample on this night measured:
| color | α (nebula) | β (stars) | correlation per 58.7″ cell | smoothed over 1.5 cells |
|---|---|---|---|---|
| R | 1.30 | 1.35 to 1.38 | 0.73 | 0.89 |
| G | 1.37 to 1.46 | 1.06 to 1.08 | 0.64 | 0.82 |
| B | 1.41 | 1.23 to 1.31 | 0.37 | 0.63 |
Ranges are the two pairings of halves. The kernel's own integral inside 15′ is 0.22 (0.20 in B), so α × 0.22 = 0.29 to 0.32, which matches the diffraction fit's whole peak (0.29 to 0.31): the factor of about 1.35 is the part of the peak beyond 15′ that the profile could not measure above the zero level. That is a consistent reading, not a prediction; nothing here was held out.
Scale test (the intercept map regressed on the slope map in three bands of spatial scale, halves crossed): under 3′ −0.04 / −0.06 / −0.09, 3′ to 12′ −0.17 / −0.20 / −0.18, over 12′ +0.50 / +0.52 / +0.32 (R / G / B), against 0.00, 0.09 to 0.11 and 0.22 to 0.24 predicted by the kernel for the nebula alone. The fine band carries no scattered light, as expected. The middle band is negative because the faint stars' glows (positive in the intercept, negative in the slope, 3′ to 12′ across) outweigh the nebula there; the coarse band is 1.5 to 2.2 times the prediction. The closure fit above, which models the stars, is the cleaner version of this test.
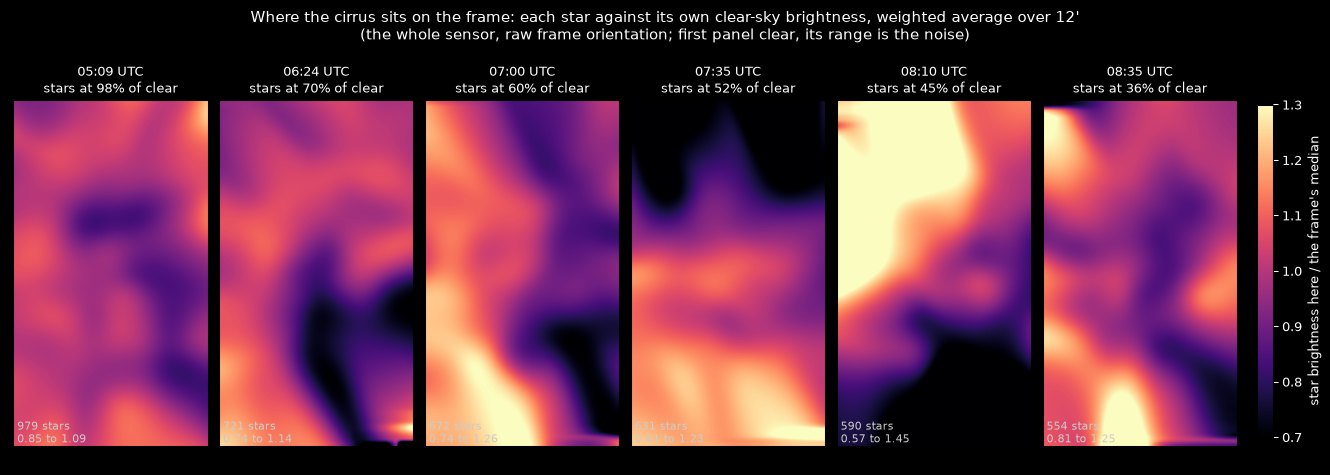
Thin cirrus isn't a uniform sheet. Measuring every star in a sub against its own clear-sky brightness shows how the cloud varied across the frame: in bands and edges half a degree to a degree across, different in every sub measured. On a clear sub, the spread is just measurement noise; under cirrus it is two to five times wider.
Per sub, 550 to 980 stars (G 8 to 13), each against its own clear median, divided by the clear subs' own map on the sensor (the raw frames carry vignetting), weighted by S/N, smoothed with a 12′ Gaussian. The 5th to 95th percentile over the frame is 0.90 to 1.09 on clear subs (the noise), and 0.74 to 1.14, 0.74 to 1.26, 0.61 to 1.23, 0.57 to 1.45 and 0.81 to 1.25 on the five cloudy samples: 11 to 26 % rms in t at 12′ after removing the noise measured. One transparency number per sub can't correct this.
None of this is a fault of the telescope. It's the atmosphere, and any camera would see it.
Before measuring anything in the images, I wrote down seven expectations from the scattering theory and the weather. Two were met outright, three only in part, one was right in kind but outside the range I gave, and one missed. The straight-line growth with the slope I expected (0.17) was met; the glow's brightness at two distances was within about 15 % of the guess; the glow's shape was not the simple power law I expected; and the extra nebula light was not equal in all three colors within the 10 % I allowed measured. The slope I expected came from six simulated frames of this same night, so meeting it is a consistency check, not an independent test. The table in the technical version lists all seven.
| Written before any image was measured | Measured |
|---|---|
| 1. E linear in 1/T through zero, slope 0.17 ± 0.07, out to T 0.3 | Met: 0.170 / 0.205 / 0.161, intercepts within 0.01, linear down to the sample's limit (T 0.35) |
| 2. A glow centered on bright stars; ξ Cyg 15 ADU per pixel at 2.4′ and 0.7 at 12′ on a T 0.6 sub; a gradient toward Deneb | Met for ξ Cyg: 16 and 0.6 ADU. The Deneb gradient: not seen (below the zero level) |
| 3. A narrow peak: HG with g ≥ 0.98; a power law of index −2 to −3 from 37″ to 1° | Met for HG (0.999). Missed for the power law: flat core to 2′, steeper than −3 past 8′. The reason I gave (the wing-fraction correlation) was mostly a background artifact |
| 4. Energy: the glow's integral 0.15 to 0.5 of the lost light; the nebula's ωfn within 1.5× of the glow's share at nebula scales | Met: 0.21 to 0.23 inside 12 to 19′, 0.29 to 0.31 for the whole fitted peak; nebula 0.16 to 0.21 per sub, α 1.30 to 1.46 in the map fit |
| 5. Scale: excess on fine structure 0.3 to 0.7 of that on coarse structure | Met in kind, outside the range: fine 0 or below, coarse 0.3 to 0.5. Not scale-free |
| 6. Gray: slopes equal within 10 %, per-color transparency within 3 % | Missed for the slopes: G's 21 to 27 % above R's and B's. Narrowly missed for the extinction: R's 3.5 % off G's, B's 1.2 % |
| 7. The sky rises a few ADU on cloudy subs while the Moon is up, less after | Partly: R +4.1 ADU with the Moon up, G and B flat; after moonset the cloudy sky is far below the moonlit clear one |
Changed after looking: the transparency check moved from annulus medians to clipped means once the medians proved biased; the extraction's own per-color zero points (biased by faint-star noise under cloud) are not used anywhere. Fitted on this night: the glow's shape and size, its amplitude scale α, the patchiness. Taken from elsewhere: Gaia DR3 star positions and magnitudes; ERA5 cloud; the LP filter's two windows (656 nm and about 500 nm).
Simple diffraction theory says large crystals should bend half of the light they remove into the forward glow. I found about 30 % measured. The rest is scattered to wider angles than one frame can see, by smaller crystals or by light refracting through the crystals, or some of the dimming isn't ice at all inferred.
Peak albedo 0.29 to 0.31 against 0.5 for the diffraction part of extinction by opaque particles much larger than λ: 60 % of a pure-diffraction peak. The remainder goes beyond the 60′ fit range (refraction through the crystals, the 22° halo, small crystals), or is not ice inferred. The frame spans about 4°, so wide-angle ice optics are out of reach.
Diffraction makes a narrower glow for shorter wavelengths, so the glow in red light should be wider and fainter in its center than in green. It isn't: red and green match in the middle measured. This is a weak test, because the red light near ξ Cygni is mixed with the nebula's own red glow.
Diffraction scaling predicts R's core at (501/656)2 = 0.58 of G's. Measured R/G at 1 to 2′ is 1.0 to 1.1, rising to 1.3 to 1.6 at 5 to 7′ where the Hα nebula enters. B/G is 1.0 everywhere, but with the LP filter B and G sample nearly the same wavelength, so that is expected either way. Not seen; weak test.
The glow measured around one star explains the pattern of extra light across the whole frame, but only after scaling it up by about 1.3 to 1.5 for the nebula and 1.1 to 1.4 for the stars, and those factors were fitted on the same night measured. A likely reason is the part of the glow too faint to measure beyond 15′ inferred.
α = 1.30 to 1.46 and β = 1.06 to 1.38, in-sample. α × 0.22 agrees with the diffraction fit's whole peak, which is why I read the factor as the unmeasured outer peak, but that is a consistency, not a test.
174 of the night's 906 subs, mostly the cloudiest, weren't in the copy of the frames I analyzed. The results cover stars down to about 30 % of their clear brightness, not thicker cloud measured.
Median T of the missing subs 0.31 (t 0.27). The straight line is shown to t 0.30; I don't extrapolate it below.
As a check, I looked for the same glow on a clear night of the Andromeda Galaxy (M 31) with the same telescope. On one frame tested against that night's own average, there was no measurable extra glow measured. But that test can only see a glow that changes during the night; a thin veil present all night long would hide from it. The weather record showed no cloud that night stated.
S30 Pro, M 31, night of 18 to 19 September 2026, 352 subs, t percentiles 1/50/99 % = 0.948 / 0.990 / 1.008. Fitting the frame's residual (galaxy brightness fixed) against the glow template K ∗ S plus a degree-2 surface: A = ω(1 − t) = 0.002 to 0.006 in the four Bayer planes, within 1.1σ of zero, with errors from a 16-tile jackknife (3 to 5 times the formal ones). The 2σ bound is about 0.02 to 0.03, set by model error, not noise. With the galaxy brightness left free, cloud-shaped terms of 1.1 to 3.5σ appear in all four planes (galaxy scale 0.97 to 0.98); leaving out the core changes nothing, so they come from the disk. Whether that is a sky offset or a galaxy-shape error is not settled; the stars' zero points argue against cloud at only about 2σ. Both bounds are relative to that night's own clear ceiling. Illustration only, on a night already used for other work.
The North America Nebula stack made from this same night corrected each sub for cloud color by color and found green losing more than red and blue. The measurement here finds the cloud gray within a few percent measured. That page also found its star colors got worse after the correction, which fits the cloud being gray inferred. I haven't redone that stack.
That correction used per-sub, per-color transparencies from about 80 Gaia stars with spectra and reported a non-gray loss (green about 20 % more). Here, with clipped-mean backgrounds and 174 stars in fixed apertures, ln tR/ln tG = 0.965. One difference is how the background around each star is estimated, the bias described under what it means; I haven't checked whether that explains it. The synthetic-sky page summarizes this cloud result too and gives the crystal size as about 45 μm across; it is the radius (about 90 μm across), and its “exactly the amount the theory says” overstates what is a fitted line.
Status: exploratory. One night, one telescope, one cloud. The glow's shape, size and amount were fitted on this night. A second cirrus night, analyzed with everything here held fixed, is the test.
Every sub was matched to the Gaia star catalog (plate solving: working out exactly where in the sky each pixel points), so the same patch of sky could be followed through the night while the field rotated. For each 1′ patch I split its brightness into two parts: light that fades in step with the stars, and light that stays when they fade. The second part is what the cloud adds. The star dimming itself came from about 100 stars per sub, each compared with its own brightness on the clear part of the night. The glow around ξ Cygni came from the same split, done ring by ring around the star.
Raw subs debayered into R, G and B planes (7.34″ per plane pixel). Stars with G < 15 masked (bright stars only inside 3 plane pixels), 8 × 8 block clipped means resampled onto one 58.7″ sky grid; per cell, value = a + b Ti + Pi(u, v), Pi a degree-2 surface in the sensor frame, solved by alternating least squares over 732 subs. Per-cell noise 3.7 / 1.9 / 4.2 ADU per sub (R / G / B), 0.76 / 0.39 / 0.84 ADU on a. Inner glow profiles from per-sub pixel rings 3 to 64 plane pixels around the star in 8 sectors. Ensemble photometry in 22, 37, 59 and 88″ apertures with clipped-mean annuli. Extraction took about 5 minutes on 4 cores; each map fit 3 to 4 minutes.
 SkyCruncher